
Figure 2.
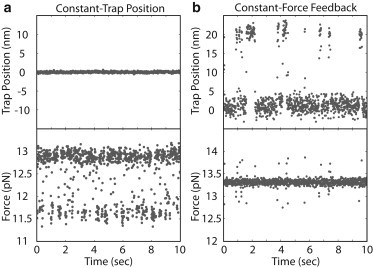
Constant-trap-position and constant-force-feedback experimental data. (a) Trap position and force versus time for a constant-trap-position experiment. (b) Trap position and force versus time for a constant-force-feedback experiment. Data averaged down to 100 Hz.