Figure 3.

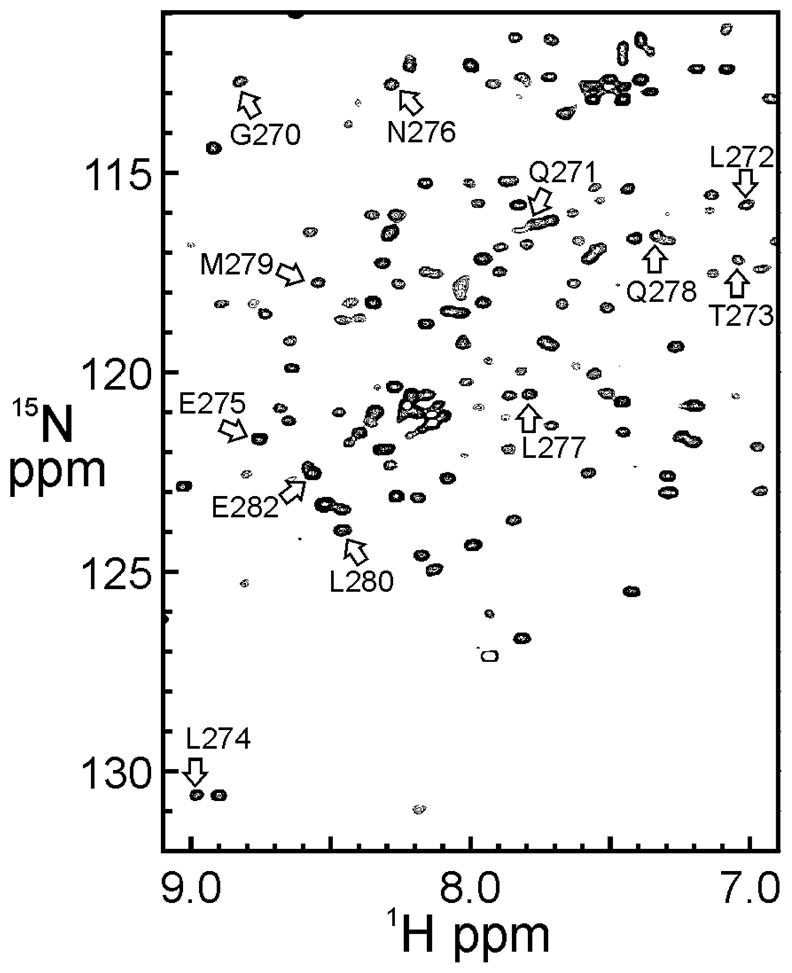
Portion of a 2D 1H-15N TROSY-HSQC spectrum of 15N-labeled IκBα (67–287) in complex with deuterated p65(19–321)/p50(248–350). Resonance assignments for the residues in Table 1 are shown [adapted from (Sue and Dyson, 2009)].

Portion of a 2D 1H-15N TROSY-HSQC spectrum of 15N-labeled IκBα (67–287) in complex with deuterated p65(19–321)/p50(248–350). Resonance assignments for the residues in Table 1 are shown [adapted from (Sue and Dyson, 2009)].