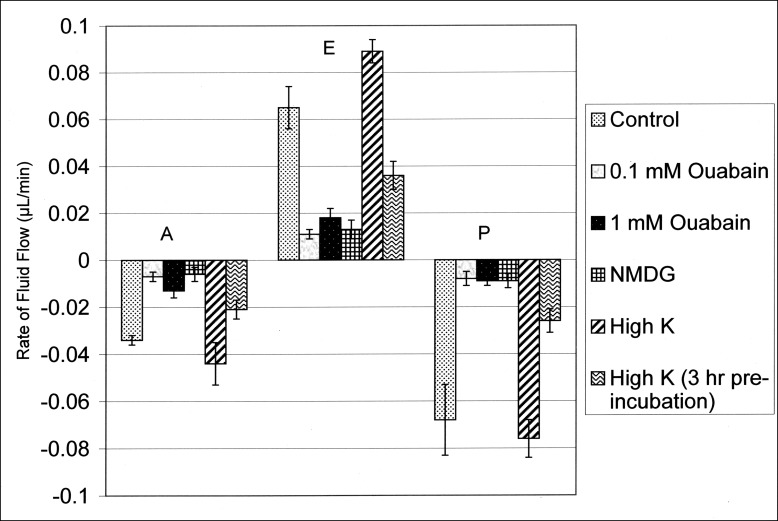
Figure 5. .
Summary plot of data (means ± SEMs) from Tables 4 through 8 for fluid flows across the anterior (A), equatorial (E), and posterior (P) surfaces during the first hour. Control values are from Table 2. Fluid flow in each compartment in the presence of an experimental perturbation is significantly different from its respective control value as unpaired two-tailed data (P < 0.05), except for the values of the flows in the A and P compartments for the high-K+ condition, where the flows are indistinguishable from their respective control values, P > 0.55, as unpaired two-tailed data. The flow in the E compartment for this latter condition (0.089 μL/min) is significantly higher than its control value, 0.065 μL/min (P < 0.05).

