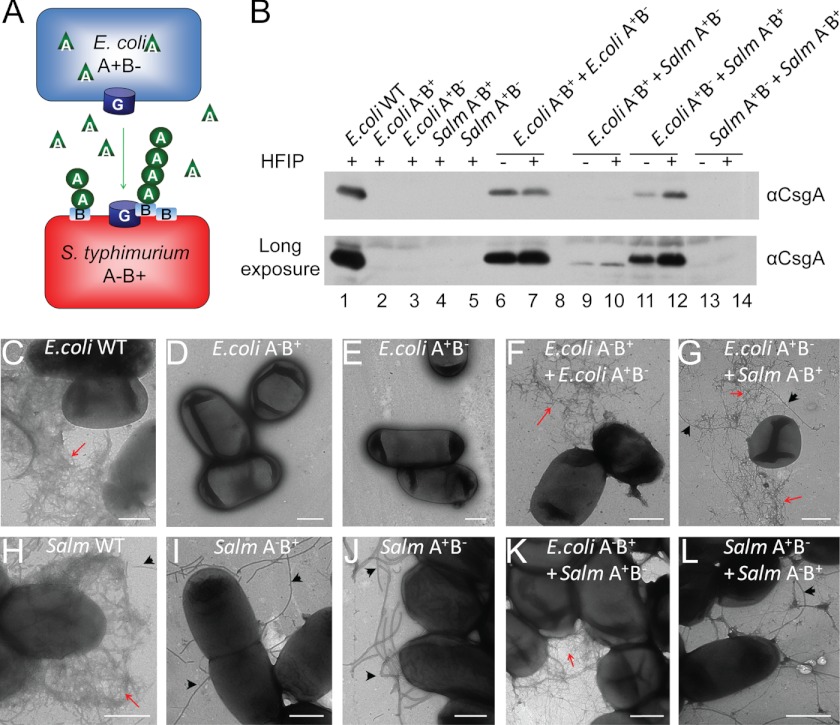
FIGURE 5.
Interbacterial curli assembly between E. coli and S. typhimurium curli mutants. A, a schematic describing the interaction between an E. coli csgB− mutant (A+B−) and S. typhimurium csgA− mutant (A−B+). Unpolymerized E. coli CsgA secreted by E. coli csgB− (A+B−) is templated by CsgB on the surface of S. typhimurium csgA− (A−B+). B, Western blots of HFIP-treated (+) or nontreated (−) whole cell lysates of the indicated strains or strain mixtures. The blots were probed with aCsgA antibody. The bottom panel is a longer exposure of the same blot to visualize the faint bands. C–L, TEM of E. coli WT (C), E. coli csgA− (A−B+) (D), E. coli csgB− (A+B−) (E), a mixed colony with E. coli csgA− (A−B+) and E. coli csgB− (A+B−) (F), a mixture of S. typhimurium csgA− (A−B+) and E. coli csgB− (A+B−) (G), S. typhimurium WT (H), S. typhimurium csgA− (A−B+) (I), S. typhimurium csgB− (A+B−) (J), a mixture of E. coli csgA− (A−B+) and S. typhimurium csgB− (A+B−) (K), and a mixture of S. typhimurium csgA− (A−B+) and S. typhimurium csgB− (A+B−) (L). Curli fibers are indicated by red arrows and flagella are indicated by black arrows. Scale bars equal to 500 nm.

