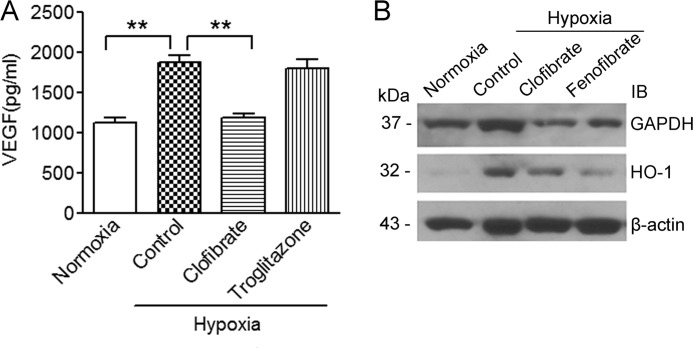
FIGURE 6.
Clofibrate suppresses hypoxia-inducible gene expression. A, MCF-7 cells were treated with 500 μm clofibrate or 20 μm troglitazone for 4 h prior to placement in a hypoxia chamber for 16 h. The amount of VEGF in the medium was analyzed using an ELISA assay kit. Data (mean ± S.D., n = 3) are expressed as picograms/million liters of medium. **, p < 0.01 compared with untreated cells using one-way ANOVA, followed by Dunnett's analysis. B, MCF-7 cells were treated with 500 μm clofibrate or 100 μm fenofibrate for 4 h prior to placement in a hypoxia chamber for 16 h. Cell lysates were prepared, and Western blotting was performed using antibodies against GAPDH, HO-1, and β-actin. Shown are representative images of three individual experiments. IB, immunoblot.

