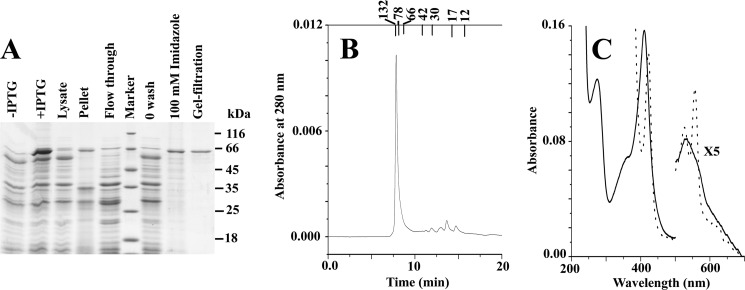
FIGURE 3.
Physical characterization of LmNcb5or. Panel A indicates SDS-PAGE. Panel B indicates the size exclusion chromatography of LmNcb5or after purification by using a Protein pak125 SW HPLC column. Panel C indicates electronic absorption spectra of 1.5 μm LmNcb5or in 50 mm phosphate buffer, pH 7.5. The solid line and dotted line represent the spectra before and after the addition of NADH on the native enzyme respectively.

