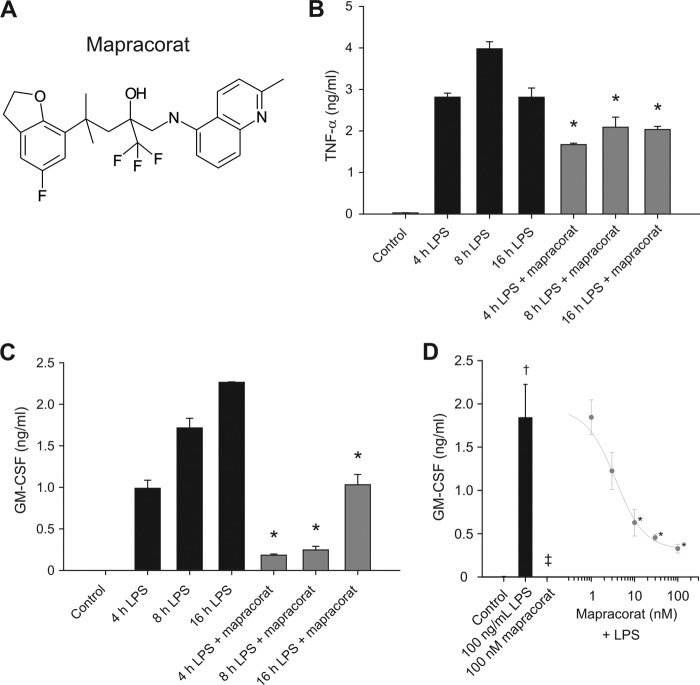
FIGURE 1.
Mapracorat inhibits the production of TNF-α and GM-CSF in LPS-stimulated Raw 264. 7 cells. A, molecular structure of mapracorat. B, inhibitory effect of mapracorat on TNF-α production. Raw 264.7 cells were treated with LPS (100 ng/ml) or with LPS (100 ng/ml) and mapracorat (100 nm) for 4, 8, and 16 h. Medium was harvested and assayed for TNF-α concentration. C, inhibitory effect of mapracorat on GM-CSF production. Cells were treated as in B, and the medium was assayed for GM-CSF. D, dose-dependent inhibition of GM-CSF production by mapracorat in LPS-stimulated cells. Cells were treated with DMSO (control in the bar on the left), or 100 ng/ml LPS (bar graph on the left), 100 nm mapracorat (bar graph on the left), or LPS plus different concentration of mapracorat (points on the line graph on the right), for 18 h. The values are expressed as means ± S.E. of three independent experiments. *, p < 0.05, compared with cytokine production in the absence of mapracorat at the same time point. †, p < 0.05, compared with cytokine production by the control cells. ‡, p < 0.05, compared with cells treated with LPS.

