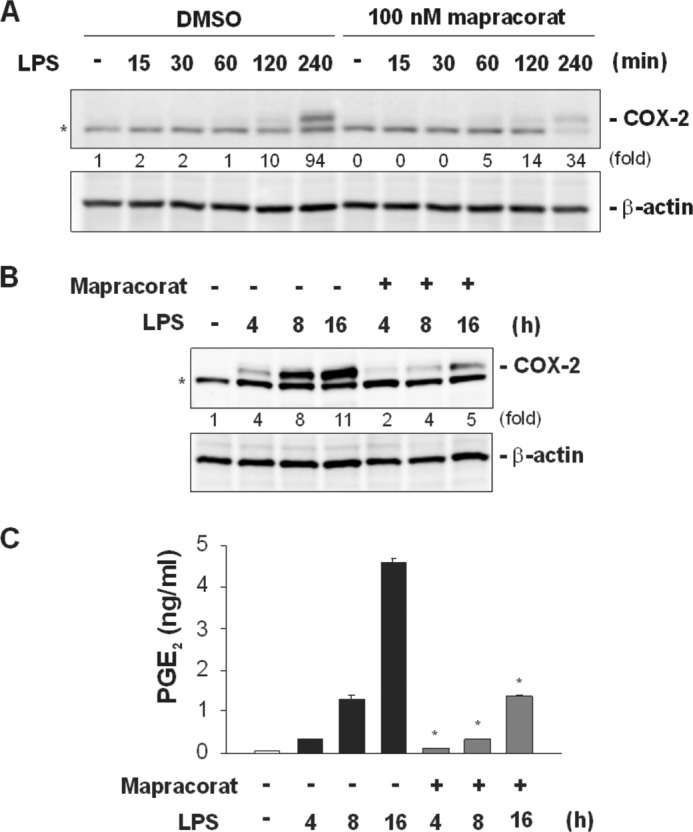
FIGURE 2.

Mapracorat attenuates the induction of COX-2 and decreases PGE2 release in LPS-stimulated Raw 264. 7 cells. A, effects of mapracorat on the kinetics of early COX-2 induction in LPS-induced macrophages. Cells were pretreated for 4 h with either vehicle (DMSO) or mapracorat (100 nm), and then stimulated with LPS. Cells were harvested at the indicated time points. COX-2 protein in the cell lysates was detected by Western blotting, using a rabbit polyclonal antibody (upper panel). The membrane was then stripped and blotted with an antibody against β-actin (lower panel), to verify comparable protein loading. B, effects of mapracorat on the later COX-2 induction. Cells were treated with LPS or LPS and 100 nm mapracorat for 4, 8, and 16 h. COX-2 protein in the cells at different time points was detected by Western blotting (upper panel). The β-actin blot serves as a loading control (lower panel). In A and B, the intensity of the bands was quantified by densitometry. The signals of the bands of interest were normalized to the loading reference bands. Values presented below the blots represent fold-increase relative to the controls (DMSO treated, without LPS treatment, whose level was set equal to 1). C, inhibition of mapracorat on PGE2 production. Cells were treated as in B, medium was harvested and assayed for PGE2 contents, by using a competitive ELISA kit. Values in the graph are means ± S.E. of three independent experiments. *, p < 0.05, compared with PGE2 production in the absence of mapracorat at the same time point. Representative images are presented in A and B. The band marked by an asterisk in A and B is a nonspecific band.
