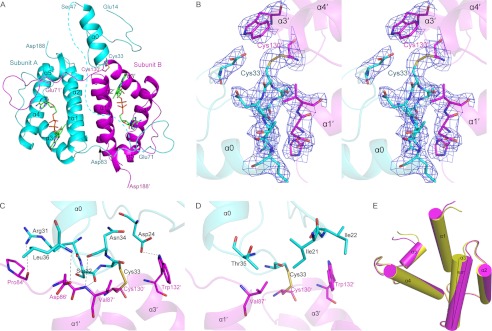
FIGURE 3.
Overall structure of Erv1FL. A, cartoon representation of Erv1FL dimer (subunit A, cyan; subunit B, magenta). The broken lines indicate the residues between NTD and CTD that could not be modeled into the electron density map. Cys33 of NTD and Cys130′ of CTD′ form a disulfide bond. B, stereo view of the 2Fo − Fc electron density map contoured at 1.00′ around the mixed disulfide bond between Cys33 of subunit A and Cys130′ of subunit B. The Cys33 and Cys130′ are shown as sticks and sulfur atoms colored yellow. C and D, hydrogen bonds (C) and hydrophobic interactions (D) between NTD of subunit A and CTD′ of subunit B. The backbone of protein is presented as a semitransparent cartoon. E, superposition of the individual core domain (yellow) and that of Erv1FL subunit B (magenta).

