FIGURE 5.
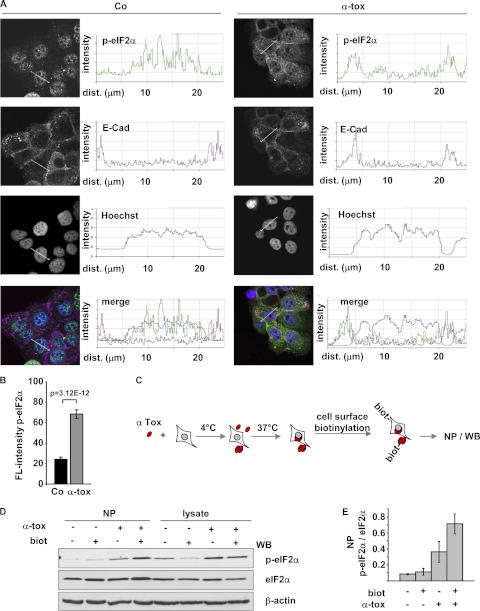
Phospho-eIF2α associates with perforated plasma membrane. A, representative confocal images and corresponding line scan intensity profiles of HaCaT cells, loaded or not (Co) with 1 μg/ml α-toxin, subsequently incubated at 37 °C for 30 min, and immunostained for p-eIF2α and E-cadherin (E-Cad). B, bar chart illustrating the increase of fluorescence (FL-) intensity (staining with anti-p-eIF2α; columns indicate mean fluorescence intensity (arbitrary units), error bars show S.E., n = 10 cells) in toxin-treated versus untreated cells from a representative experiment. C, scheme for detection of PM-associated p-eIF2α, as applied below. D, cells were loaded or not with α-toxin (1 μg/ml) and incubated at 37 °C for 40 min. Subsequently, cells were surface-biotinylated or not and lysed; lysates were subjected to NP; both lysates and precipitates were analyzed by Western blot (WB) for (p-)eIF2α. E, band intensities from the NP gels of D were measured by densitometry to estimate p-eIF2α/eIF2α associated with the PM. Columns, mean values; error bars, S.E.; n = 3.

