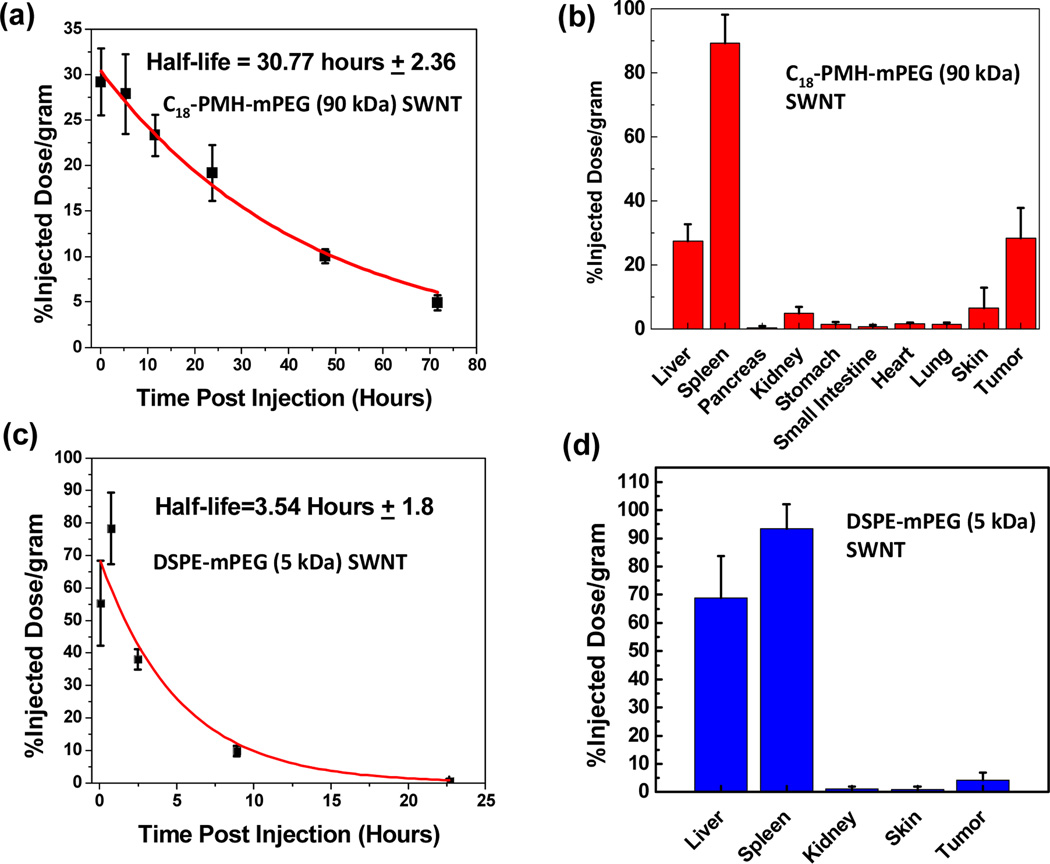
Figure 3.
a) Concentration of SWNTs (black symbols) in blood vs. time measured for an injected 90 kDa C18-PMH-mPEG SWNT solution (see Methods section). A first order exponential decay model was used for fitting (red curve). b) Biodistribution of the 90 kDa C18-PMH-mPEG SWNTs in various organs measured by collecting organs from the mice (n=4) 100 hours after injection (see Methods). c) Circulation and d) biodistribution of DSPE-mPEG (5 kDa) coated SWNT in vivo (n=3).

