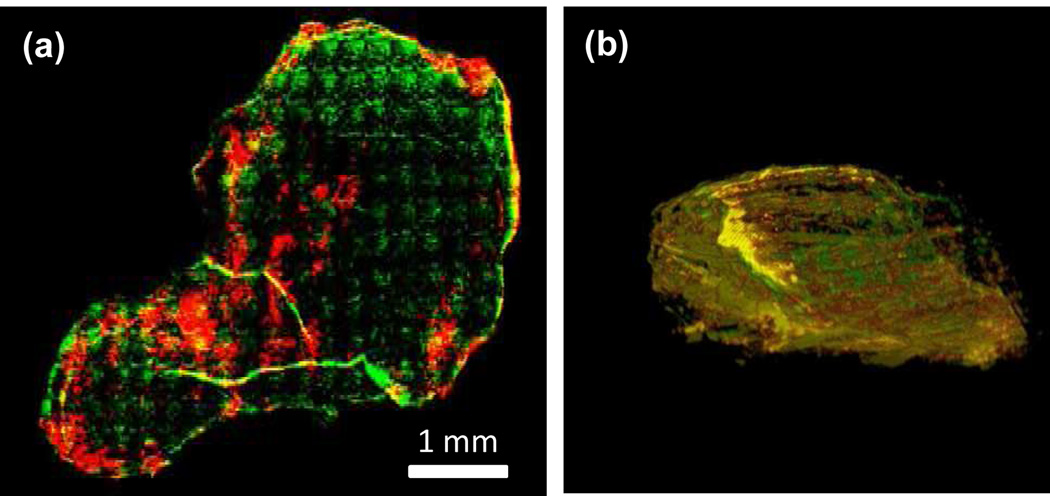
Figure 5.
Ex vivo imaging of 4T1 murine tumor slices with high SWNT uptake. (a) A tumor slice from a tumor showing the location of SWNTs (coded in red) and Cy5-labeled anti-mouse CD31 (coded in green), and their colocalization (yellow). (b) A reconstructed 3D snapshot image taken from Supplementary Movie 2 with the same color coding as in (a).

