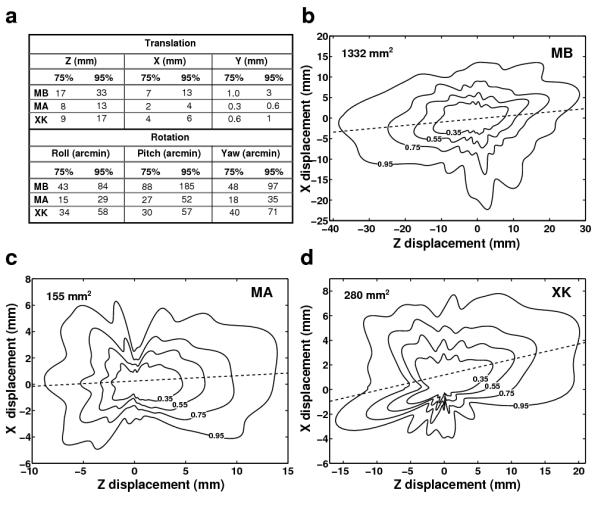
Fig. 3.

Characteristics of fixational head movements. (a) 75% and 95% confidence intervals of head translations and rotations along each degree of freedom. Different rows report data from different observers. (b-d) Probability distributions of head displacement on the horizontal plane. Contours represent confidence regions with different probabilities. Dashed lines represent the axes with maximum dispersion which deviated slightly from the Z axis. Data from different subjects are shown in different panels. The numbers in each panel represent the 95% confidence areas.
