Fig. 5.
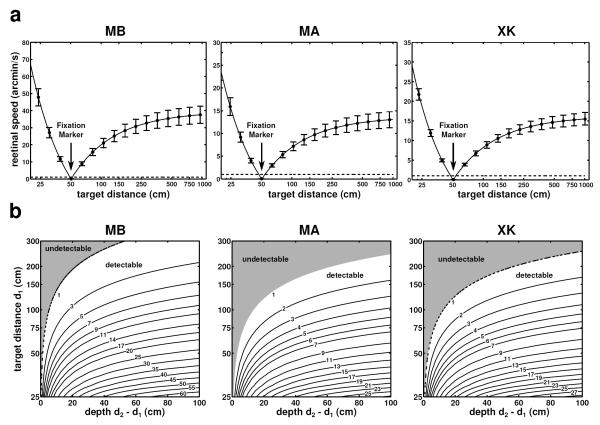
Retinal speed and motion parallax on the zero azimuth axis. (a) Mean instantaneous retinal speed of simulated point sources at different distances from the observer. Subjects maintained fixation on a marker at 50 cm (indicated by the arrow). Vertical bars represent one standard deviation. (b) Parallax between all possible pairs of points within a distance of 4 m from the observer. In each graph, the value at coordinates (x, y) represents the mean difference (in modulus) of the mean instantaneous retinal velocities of two point sources located at distances y and y + x from the observer. In both rows, different columns show data from different observers. Dashed lines in all graphs indicate a speed of 1’/s, taken here as the detection threshold of an average observer.

