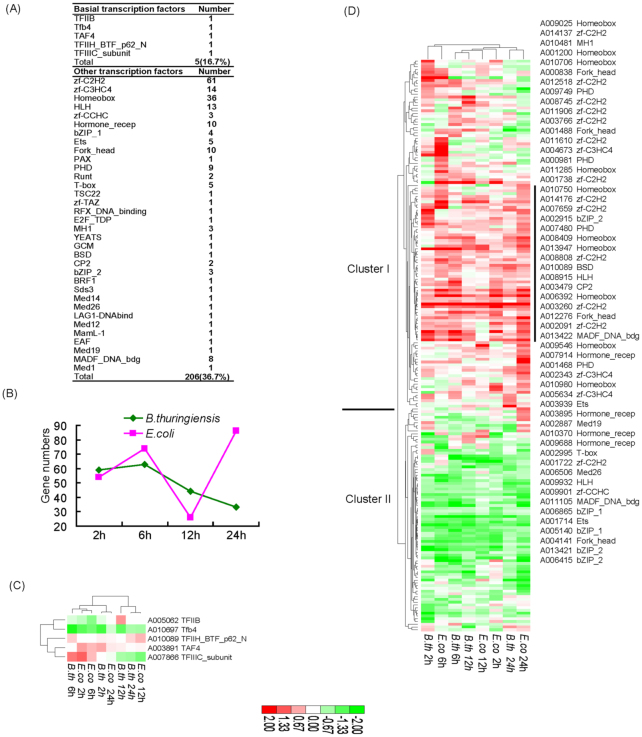
Figure 7.
Analysis of the silkworm transcription factors response to Escherichia coli and Bacillus thuringiensis directly injection. (a) Numbers of induced each domain family genes. (b) Induced gene numbers during the time course of infection. (c) Hierarchical clustering of ratios of bacterial injection induced basal factors. (d) Hierarchical clustering of ratios of microbes' induced other factors. The right showed the gene information of vertical line included up-regulation factors during the infection. The ratios of injection induced silkworm factors are shown in Table 21. The induced gene numbers of each domain are shown in Table 22. High quality figures are available online.

