
Fig. 1.
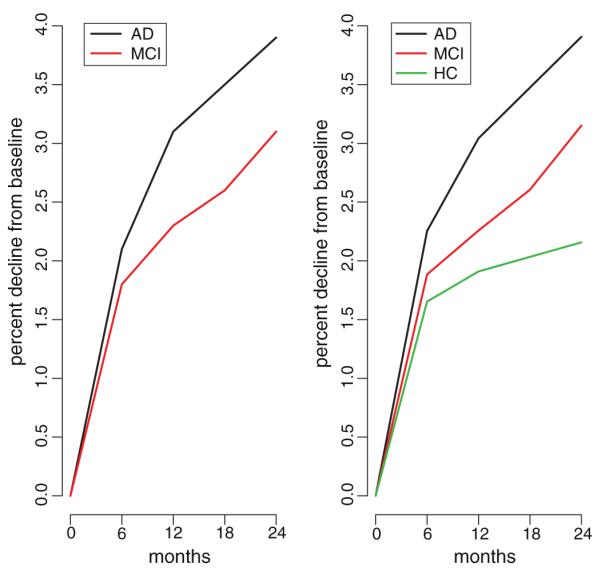
Cumulative atrophy for TBM-derived Stat-ROI. Left panel: Mean percent change in TBM-derived Stat-ROI measures for 91 AD and 189 MCI subjects in ADNI (data taken from Hua et al. (2010) Fig. 3 p. 68). Right panel: Mean percent change in TBM-derived Stat-ROI measures for 81 AD, 198 MCI, and 160 HC subjects in ADNI (data publicly-available at http://www.loni.ucla.edu, current as of May 5, 2010).