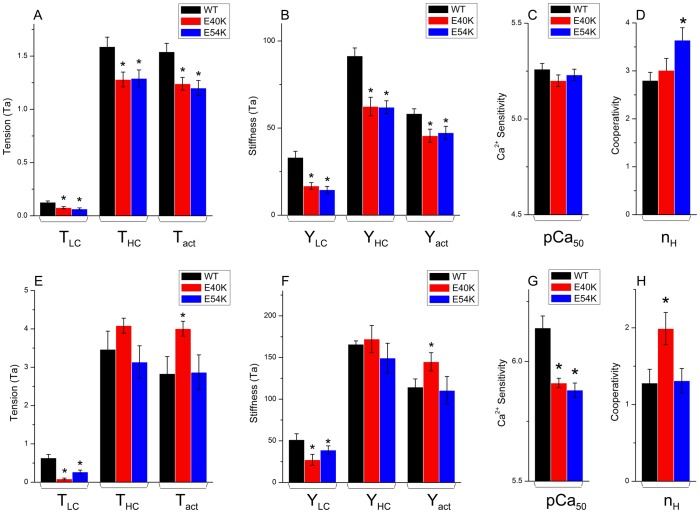
Figure 3. Summary of Tension (A and E), Stiffness (B and F), pCa50 (C and G), and Cooperativity (D and H).
(A–D) Data obtained in high-IS solutions. (E–H) Data obtained in low-IS solutions [22]. (A, E) Low calcium tension (T LC) represents the tension at pCa 7. High calcium tension (T HC) represents the tension at pCa 4.66. Active tension (T act) is the tension developed on Ca2+ activation (T act = T HC–T LC). (B, F) Results of the stiffness study. Tension and stiffness were normalized to Ta. (C, G) pCa50 (Ca2+ sensitivity). (D, H) Cooperativity. *: p<0.05.

