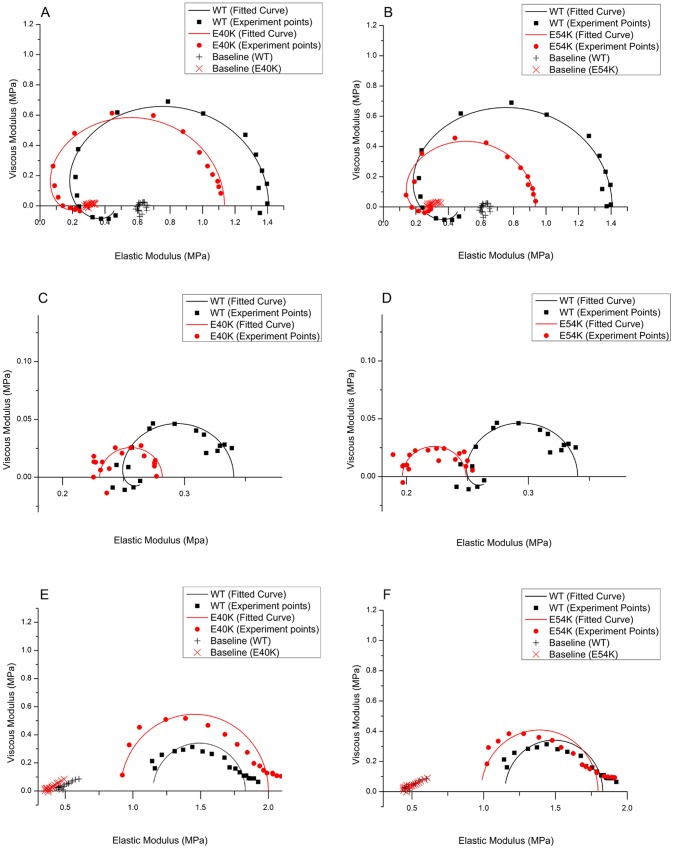
Figure 4. Nyquist plots of the mutants (red) compared to WT (black).
(A–B) Two mutants are compared to WT at pCa 4.66; (C–D) Two mutants are compared to WT at pCa 7.0. Also included in A and B are the baselines taken in the relaxing solution at 0°C (× for the mutant, and + for WT). The data in A–D were obtained in high-IS solutions. (E–F) Two mutants are compared to WT at pCa 4.66 in low-IS solution [22]. Range of frequency used: 0.13–100 Hz. The frequency increases in the clock-wise direction. Note the difference in scale for both axes in panels A–B vs. panels C–D, and panels A–B vs. panels E–F.

