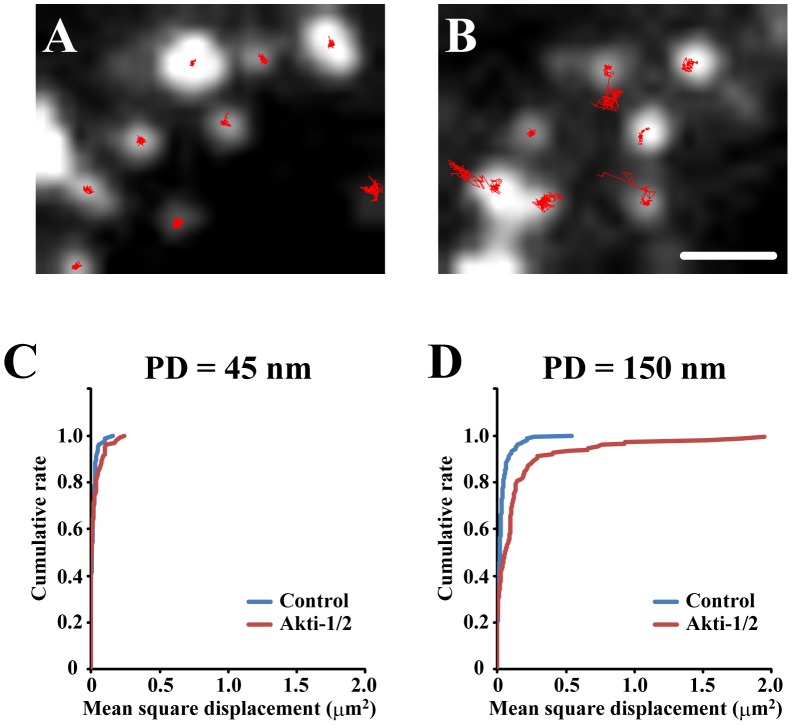
Figure 8. The effect of Akt inhibitor on dynamics of intracellular insulin granules.
(A, B) Control (A) and 1 µM Akti-1/2 treated β-cells (B) expressing insulin-GFP were observed under TIRF microscopy with PD = 150 nm and the motions of insulin granules for 1 min were manually tracked (red lines). (C, D) Cumulative plots of mean square displacement for 1min observed in TIRF microscopy with PD = 45 nm (C; n = 79 and 101 for control and Akti-1/2, respectively) and PD = 150 nm (D; n = 154 and 149 for control and Akti-1/2, respectively).

