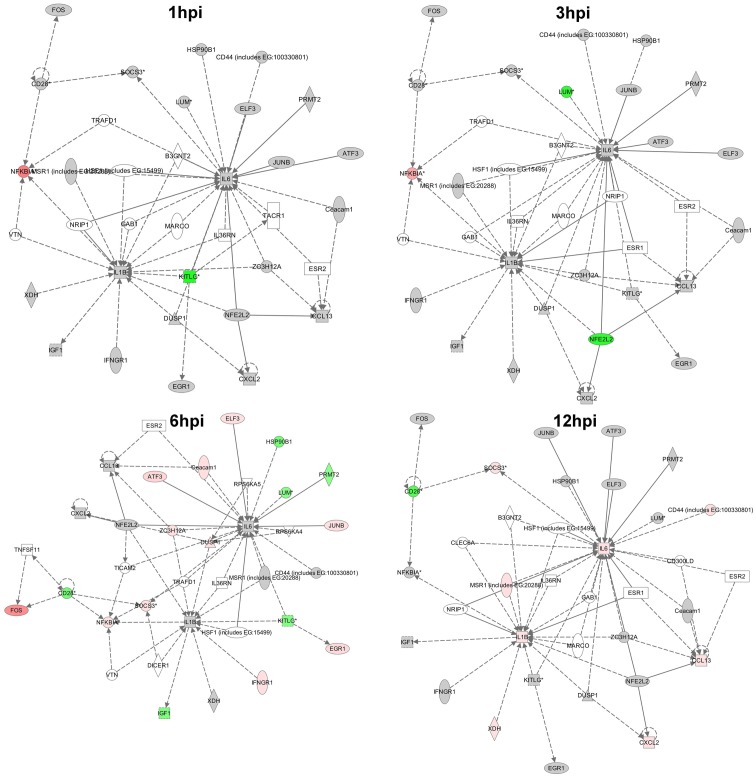
Figure 2. Diagram showing the interactions between genes and the temporal increase in representation of the acute inflammation and immune cell recruitment pathway from the IPA analysis.
Gene expression data was entered into ingenuity pathway analysis software to identify potential canonical pathways modulated during tick feeding. Upregulated genes are orange/pink, downregulated genes are green, and unchanged or unsignificant genes are grey.

