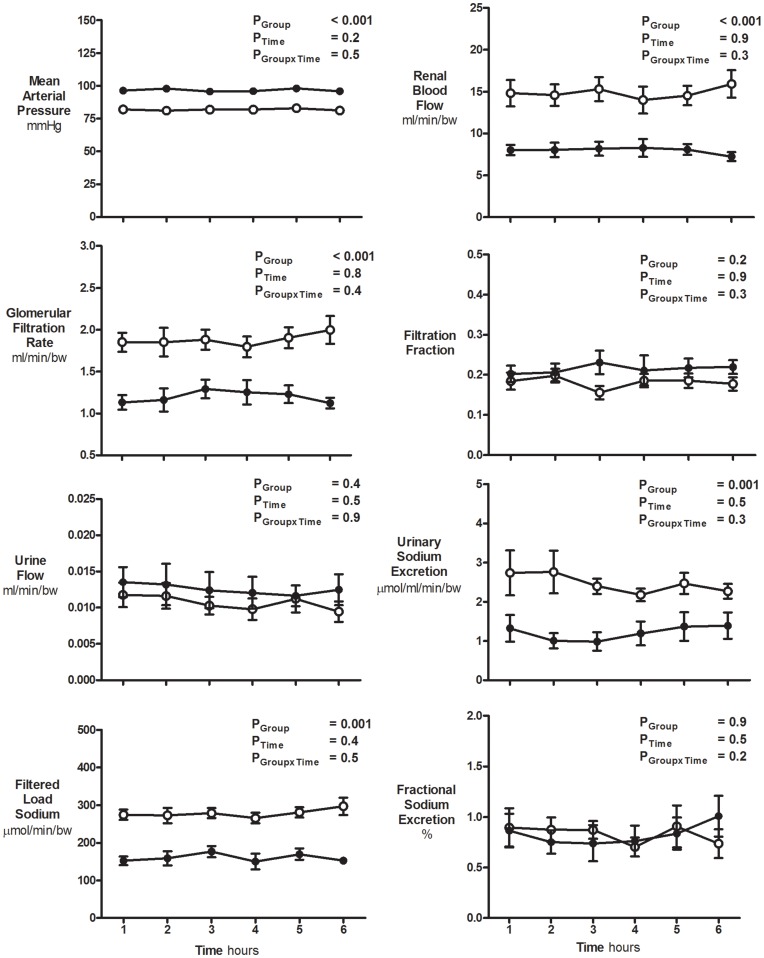
Figure 1. Basal cardiovascular and renal function during the time control study.
Variables (mean ± S.E.M) were measured at hourly intervals over a 6 hour period in 5 year old sham (n = 7; open circles) and uni-x (n = 7; closed circles) female sheep. All renal variables are presented as absolute values corrected for body weight. P values represent the results of a repeated measures ANOVA, with factors group, (sham, uni-x), time and their interaction.

