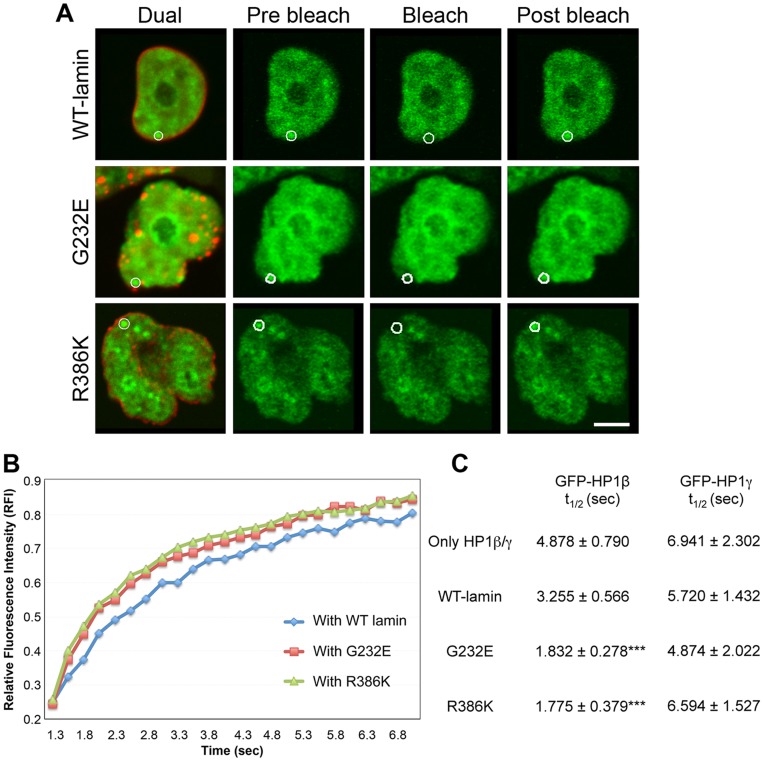
Figure 5. FRAP analysis of GFP-HP1β and GFP-HP1γ.
(A) Fluorescence images of typical dual-labeled nucleus (RFP-lamin A and GFP-HP1β) and FRAP processes of GFP-HP1β for the indicated conditions. Circles indicate areas of bleaching where fluorescence recovery was measured. The illustrated postbleach time-point is 40 sec after bleach. Bar, 5 µm. (B) Graphical presentation of fluorescence recovery as change in relative fluorescence intensity (RFI) over time. (C) Comparison of half time of recovery of GFP-HP1 in the background of wild-type and mutant RFP-lamin A. Error bars represent ± sd with n = 25 to 30 individual cells. ***p≤0.001 for mutant cells compared to wild-type lamin A expressing cells.

