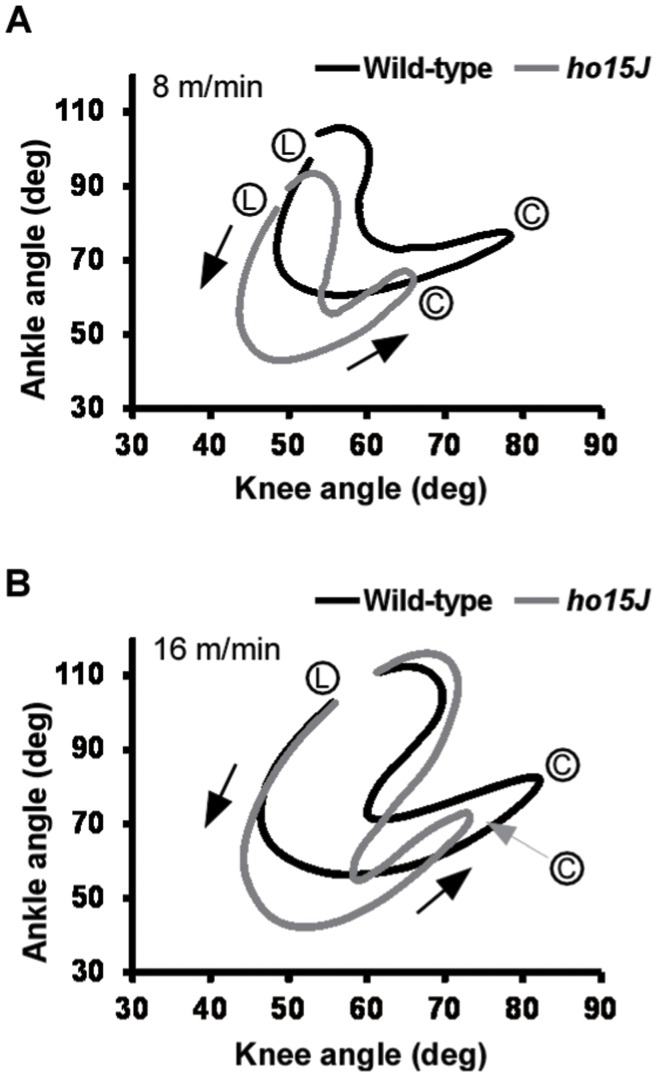
Figure 3. Mean interjoint coordination patterns during the step cycle.
Each line illustrates the averaged data for interjoint coordination patterns of the ankle and knee joints in wild-type (black) and ho15J mice (gray). (L), foot lift at the beginning of the swing phase; (C), foot contact at the beginning of the stance phase. Arrows indicate the direction of angular motions. A: 8 m/min, B: 16 m/min.

