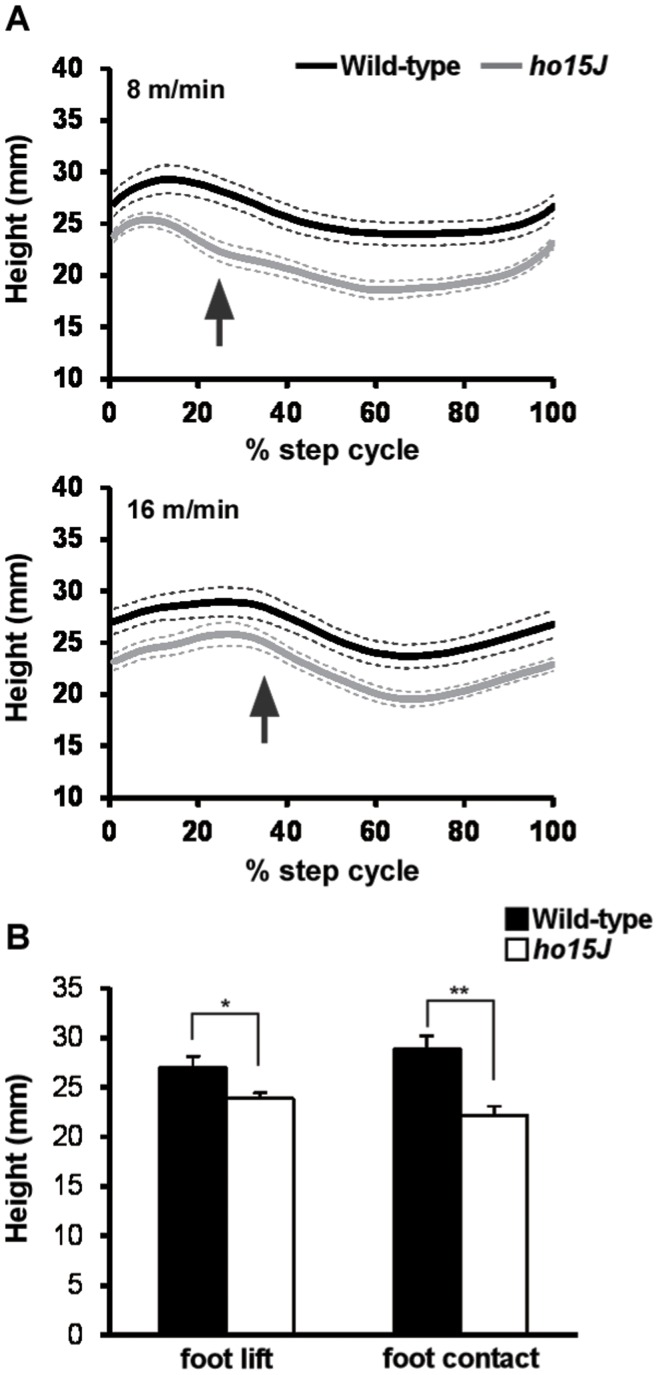
Figure 4. Great trochanter height during the step cycle.
A: Average great trochanter height displacements during the step cycle at different treadmill speeds. Great trochanter heights during the step cycle were normalized. Arrows indicate the phase change point (swing to stance). Dotted lines indicate SEM. B: Great trochanter heights at foot lift and foot contact at 8 m/min. Error bars represent SEM. *, p<0.05; **, p<0.01.

