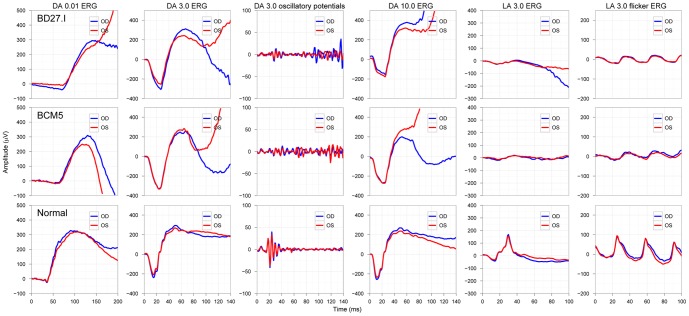
Figure 3. ISCEV standard Ganzfeld ERG responses of a representative patient of each group compared to a normal subject.
Patient BD27.I in the upper panels represents the NOP group, while the result of patient BCM5 in the middle panels is an example for the ALP group. The normal subject is represented in the bottom panels. The patients' findings show the characteristic features of the scotopic ERG (dark-adapted (DA)) and the small photopic responses (light adapted (LA). Notice the missing oscillatory potentials on the rising b-wave in patients. (Color coding in each panel: red curves show results of the right eye (OD), blue curves show results of the left eye (OS)).

