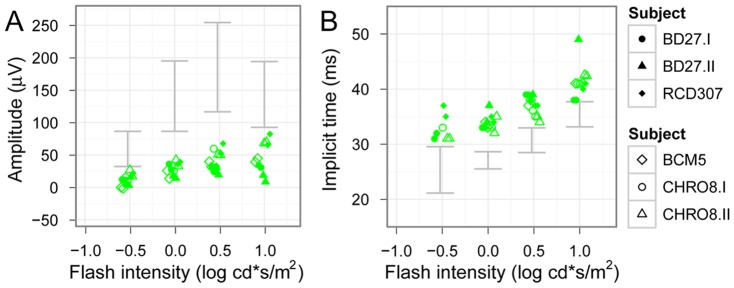
Figure 8. Intensity-response function kinetics under photopic conditions.
Photopic response b-wave amplitudes are shown in (A) and implicit times in (B), the 95% confidence band of normal subjects is marked with grey. The photopic hill phenomenon can be observed in normals, however, this phenomenon seems to be missing in patients. Implicit times in both patient groups are moderately delayed (upper subjects: NOP group, lower subjects: ALP group).

