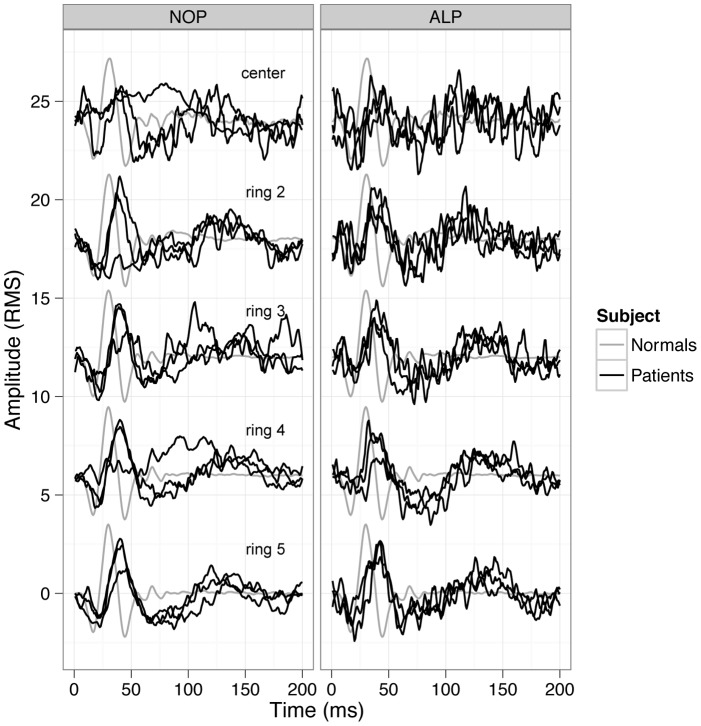
Figure 11. MfERG results.
Individual mfERG response waveforms for the subjects of each group (NOP group on the left, ALP group on the right) compared to normal subjects waveforms (black curves represent the responses of the patients, grey curves show normal responses). Responses of patients are reduced and delayed in both groups, more pronounced in the central rings. Interestingly, in the ALP group the central 2 rings tend to show more preserved responses. This could be in relation with the slightly better VA of the ALP group.

