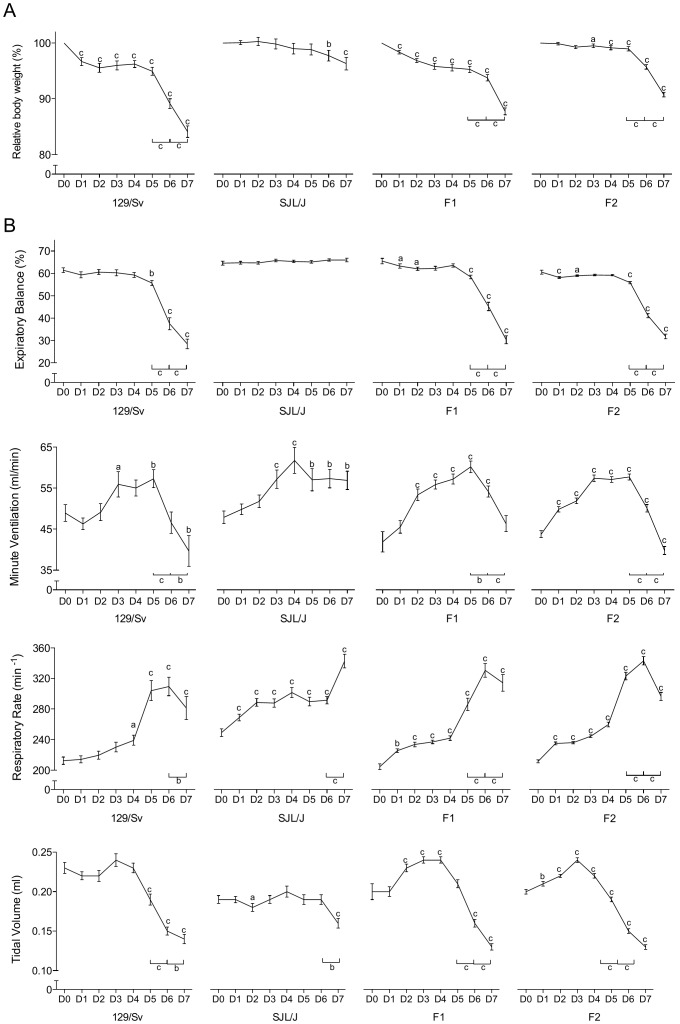
Figure 1. Morbidity and respiratory pattern values.
(A) Evolution of daily body weight within each generation from PVM inoculation to 7 days later (% of the pre-inoculation value, mean ± SEM). Means significantly different from the corresponding pre-inoculation values (on day 0) are indicated with a (p<0.05), b (p<0.01), or c (p<0.001). Significant day-to-day changes after day 5 pi are indicated also (bottom-right). (B) Respiratory dysfunctions were measured using a double chamber plethysmograph. Before and at selected time points after intranasal inoculation of PVM, minute ventilation (MV), expiratory balance (EB), respiratory rate (RR) and tidal volume (TV) were determined within each generation (mean ± SEM). Means significantly different from the corresponding pre-inoculation values (on day 0) are indicated with a (p<0.05), b (p<0.01), or c (p<0.001). Significant day-to-day changes after day 5 pi are indicated also (bottom-right).

