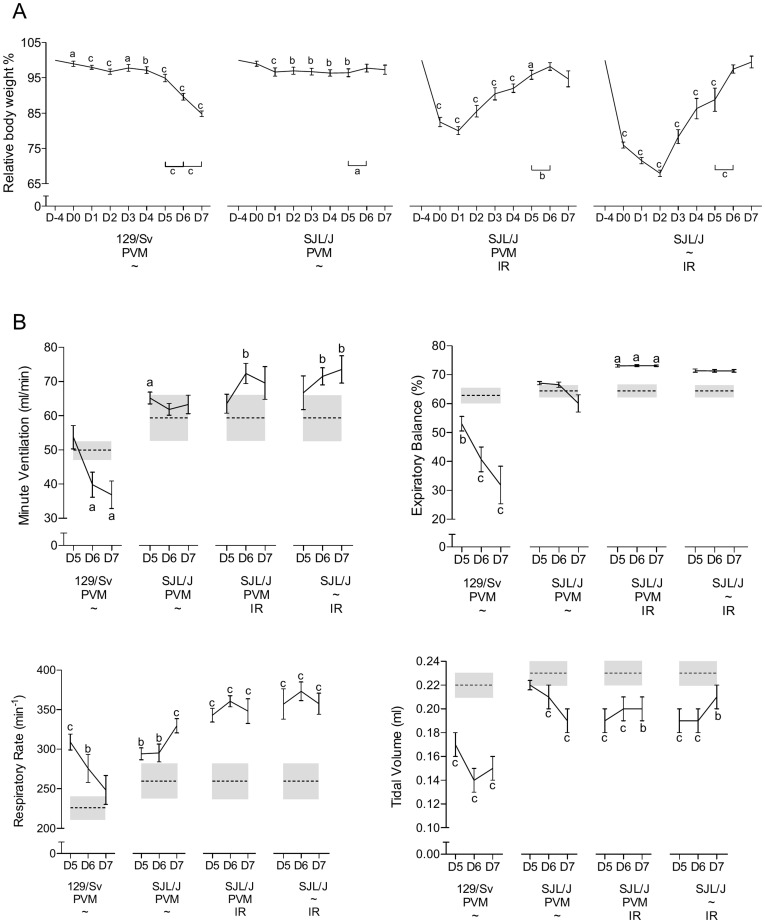
Figure 5. Effect of whole-body γ-irradiation.
(A) Evolution of body weight from PVM or mock (∼) inoculation to 7 days later in non-irradiated (∼) 129/Sv (susceptible) and SJL/J (resistant) controls and in irradiated SJL/J principals (mean ± SEM). Means significantly different from the corresponding pre-inoculation values (on day −4) are indicated with a (p<0.05), b (p<0.01), or c (p<0.001). Significant day-to-day changes after day 5 pi are also indicated (bottom-right). IR, whole-body γ-irradiation. (B) Respiratory dysfunctions were measured using a double chamber plethysmograph. Before and at selected time points after intranasal inoculation of PVM or sterilized inoculum (∼), minute ventilation (MV), expiratory balance (EB), respiratory rate (RR) and tidal volume (TV) values were determined for each group: the non irradiated infected 129/Sv (susceptible) and SJL/J (resistant) controls, the irradiated infected SJL/J principals and the irradiated mock infected (∼) SJL/J (mean ± SEM). Means significantly different from the corresponding pre-inoculation values (on day −4) are indicated with a (p<0.05), b (p<0.01), or c (p<0.001). Gray boxes show the means (dotted line) and SEM (height) of the corresponding pre-inoculation values. IR, whole-body γ-irradiation.

