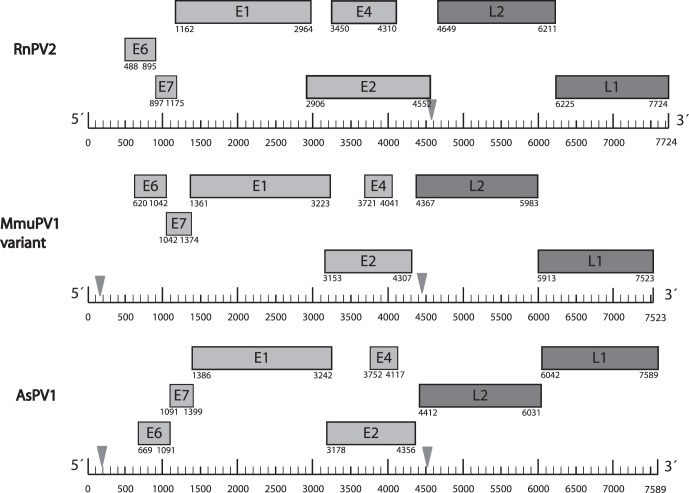
Figure 1. Genome organization of RnPV2, MmuPV1 variant, and AsPV1.
Boxes indicating PV genes are drawn to scale and genes are drawn in three lines representing three putative open reading frames relative to nt position zero at the beginning of the upstream regulatory region. The polyadenylation sites are indicated with triangles.

