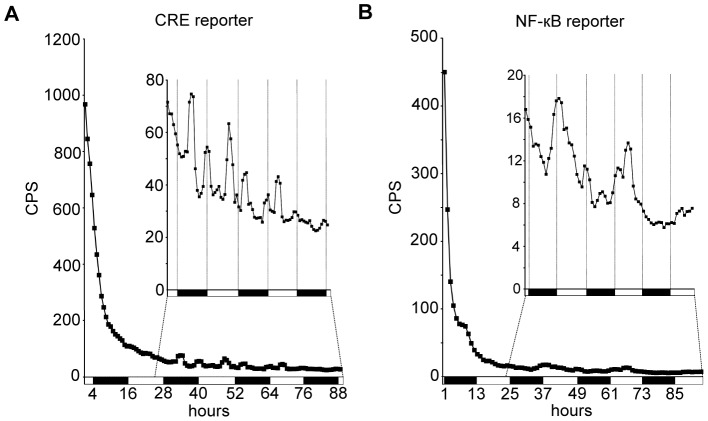
Figure 5. Oscillations in dCREB2 and NF-κB activity persist after luciferin removal.
(A) Reporter activity in UAS-FLP/+;CRE-F-luc/actin-GAL4 flies starting ∼1 h following luciferin removal, plotted as a function of time. The inset shows a scaled view of the same data, with the first 24 h dropped. (B) Reporter activity in UAS-FLP/+;NFκB-F-luc/actin-GAL4 flies starting ∼1 h following luciferin removal. Inset shows a scaled view of the same data, with the first 24 h dropped. n = 24 flies for each group.

