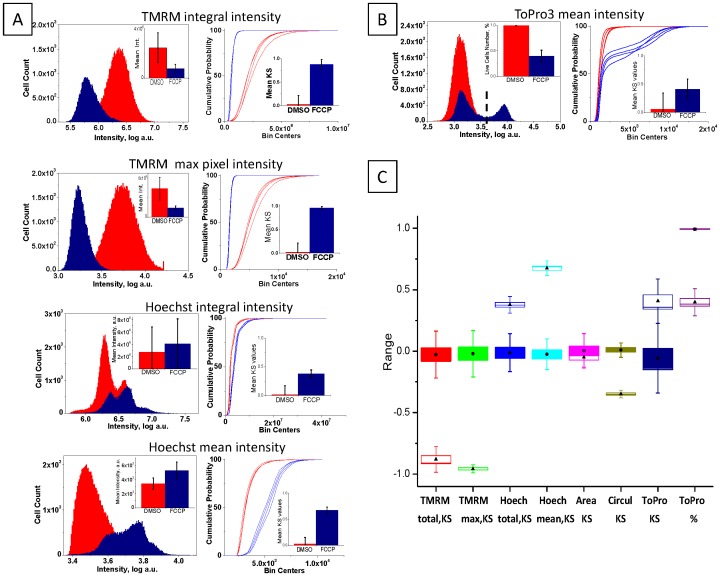
Figure 2. Definition and selection of statistical measure of parameters.
Forty-eight FCCP-treated and 48 non-treated (DMSO) samples were used for statistical analysis of population variability. Seven iCys output parameters were selected for the analysis: TMRM peripheral integral and max pixel intensity, Hoechst33342 integral and mean intensity, nuclear area and circularity, and TO-PRO-3 mean intensity. A. Right panel shows histograms of parameter distribution for untreated (red) and FCCP-treated (blue) samples. Insert bar graphs demonstrates mean values with standard deviation for all parameters. The left panel shows the corresponding cumulative probability functions (CPFs), which are the basis for the Kolmogorov-Smirnov (KS) value calculation. Representative four repeats of untreated (blue lines) and four repeats of FCCP-treated (red lines) samples are individually plotted to demonstrate the deviation and robustness of each parameter. Insert bar graph demonstrates mean KS values with standard deviation calculated using averaged untreated population. B. Right panel shows histograms of parameter distribution for untreated (red) and FCCP-treated (blue) samples. An empirical gating value (punctuate line) was used to quantify the number of TO-PRO-3-positive cells; and % live (TO-PRO-3-negative) cells is plotted in the insert. The left panel shows the corresponding CPFs for four representative repeats of untreated (blue lines) and FCCP-treated (red lines) samples. Insert bar graph demonstrates mean KS values with standard deviation calculated using averaged untreated population. C. Modified box-and-whiskers graph demonstrates comparative behavior of 8 statistical measures: 7 parameters as KS values and a TO-PRO-3-derived viability index in %. Boxes correspond to 95% confidence interval of the mean calculated based on 48 repeats (black circles - mean values for untreated; black triangles - for FCCP-treated populations). Standard deviation of the mean is also shown. Red - TMRM peripheral integral intensity, green - max pixel intensity, dark blue - Hoechst33342 integral intensity, blue - mean intensity, magenta - nuclear area, yellow - nuclear circularity, dark purple - TO-PRO-3 mean intensity, light purple - viability in %.

