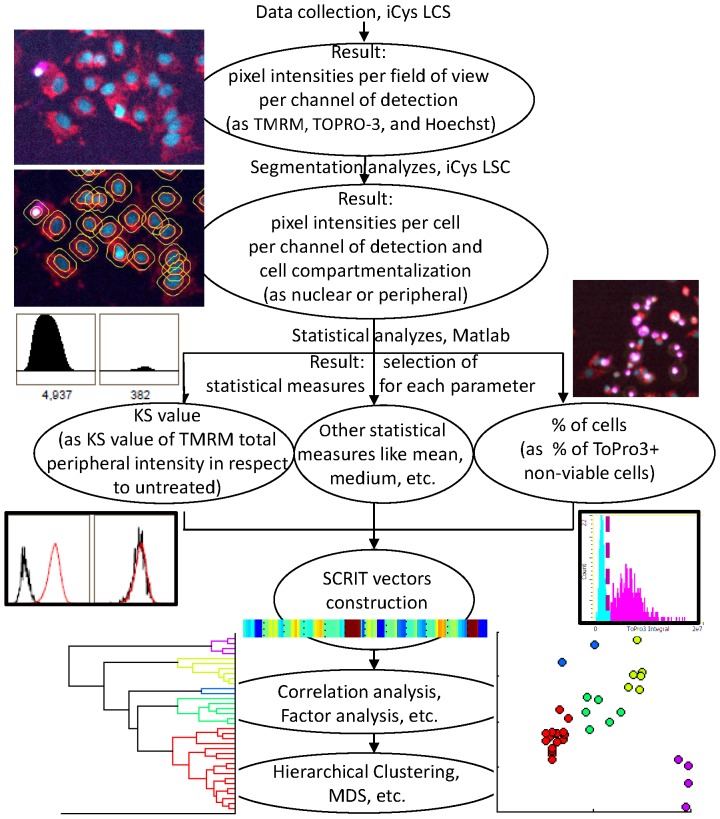
Figure 5. Schematic demonstration of high content screen and analysis.
The screen algorithm is schematically represented the steps from cell culturing to data collection and comprehensive data analysis. HepG2 cells were seeded on 96-well plates either in regular culturing medium containing 5.5 mM glucose (glu+) or in glucose-depleted (glu−) medium containing10 mM galactose instead. Compounds were incubated for 24 h. Multiple controls per plate allowed correction of systematic well-to-well changes during data analysis. After incubation for 45 min with cell markers Hoechst33342, TMRM, and TO-PRO-3, plates were analyzed on the iCys. Six fields of view, each 500 µm×369 µm, were scanned per well with a single-pixel resolution of 0.5 µm. The initial image analysis of nuclear segmentation and determination of primary peripheral interval (PI) for the cytoplasmic signal was performed using iCys Cytometric Analysis software. Nuclear segmentation was performed according to the empirically-defined Hoechst33342 intensity threshold value and maintained throughout the screening. Further data reduction included KS value calculation for each parameter derived from TMRM and Hoechst33342 markers and per cent of viable cells derived from TO-PRO-3 using the empirical gating threshold value for TO-PRO-3 intensity. All parameters were assembled in a SCRIT vector and subjected to dissimilarity metrics calculation with consecutive correlation and MDS analysis.

