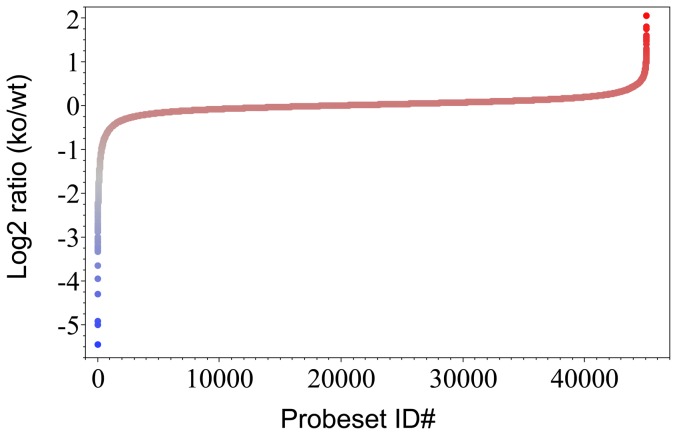
Figure 1. Gene differential expression profile of tumors from annexin A1 knockout and wild type mice.
B16 melanoma cells were implanted in annexin A1 knockout and wild type mice to grow up tumors. Whole tumors were analyzed using mouse whole genome microarray, in which for each gene, one or more than one probeset(s) were spotted for the gene. For each probeset on the microarray, the difference in gene expression between tumors from annexin A1 knockout mice and from wild type mice was expressed as log 2 ratio of the gene expression level in annexin A1 knockout (ko) over the gene expression level in wild type (wt).

