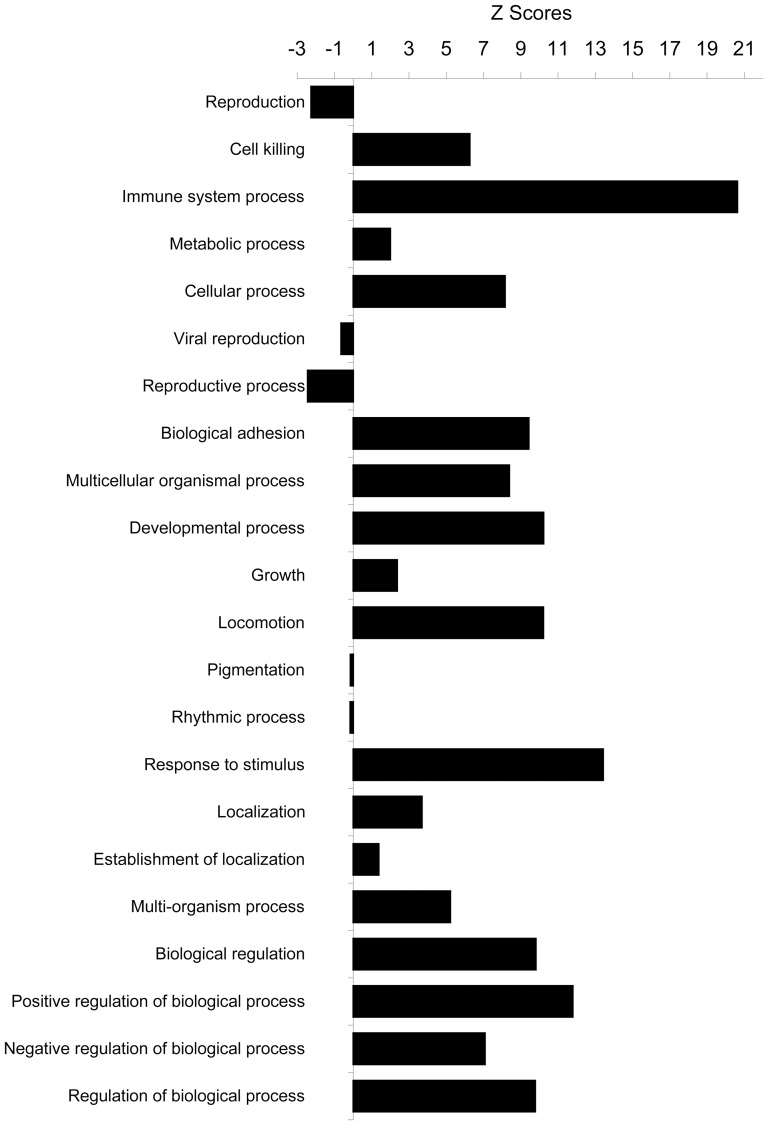
Figure 2. Biological process.
The list of significantly changed genes was analyzed with Genomatix software and examined in terms of biological processes in Gene Ontology database and expressed as the Z score of a term for each biological process within the category. The higher value of Z score means more genes in that function of biological process were affected in this experiment, thus this biological process was over-represented. The Z scores for all the biological processes in top most general level of Gene Ontology structural networks of hierarchial tree of categories of biological process were shown here.

