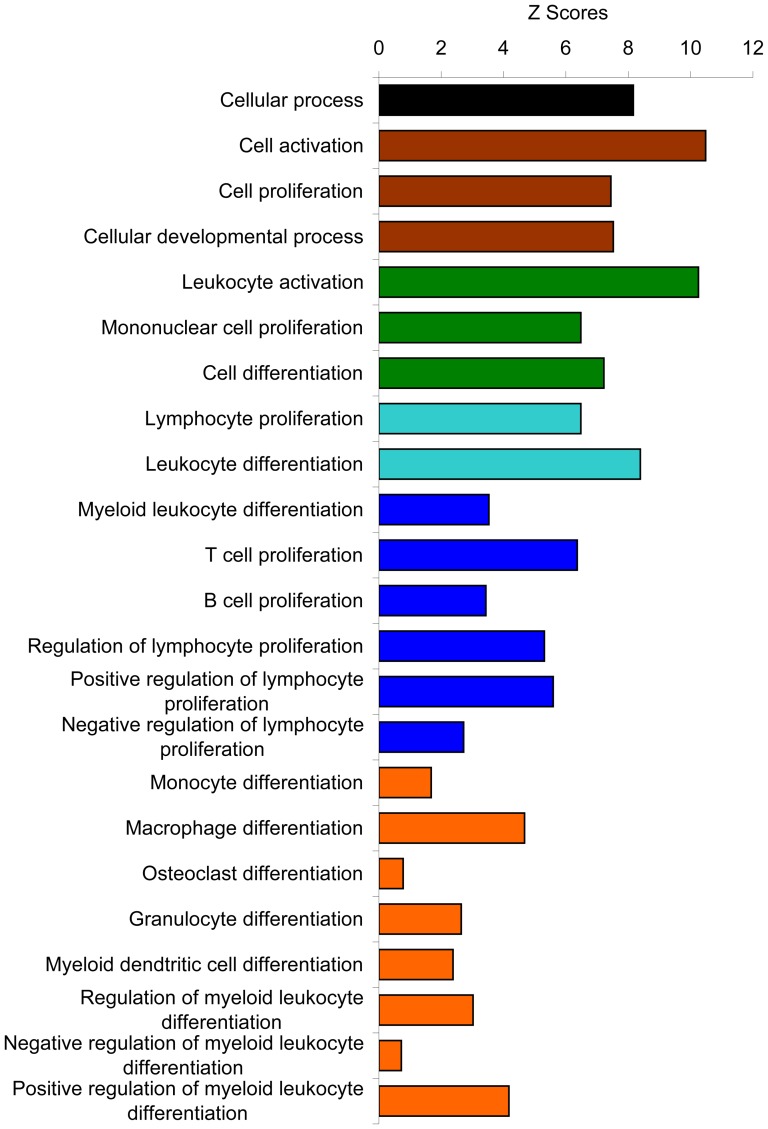
Figure 5. Cellular process.
Similarly, from Figure 2, the cellular process was further mining down levels by levels into its subcategories with all biological processes in each level shown in Figure S7 and from each level, the over-represented biological processes are summarized here. Each color represents each level in the order from top to bottom as mining down the levels from top level of the hierarchial tree in the cellular process.

