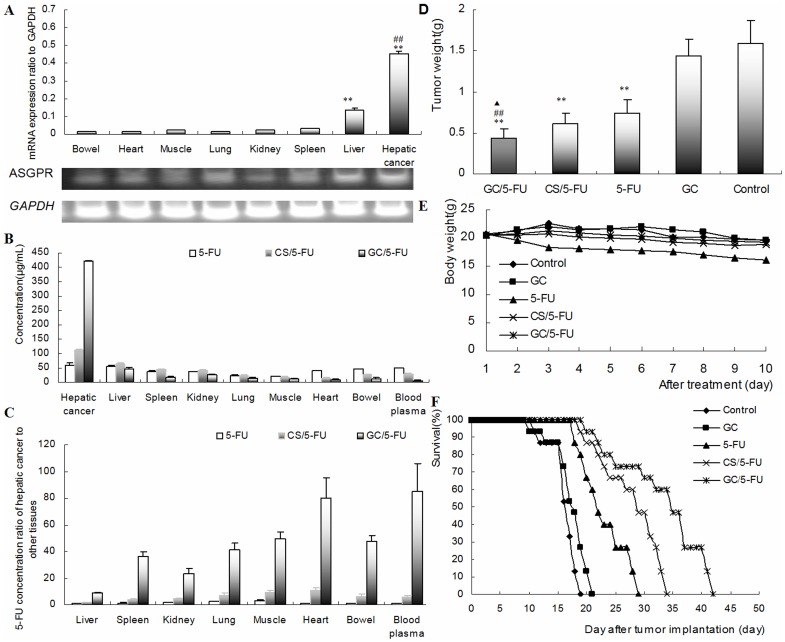
Figure 4. 5-FU nanoparticle had liver-targeting and enhanced 5-FU to inhibit the growth of hepatic caner through ASGPR in vivo.
(A) Expression of ASGPR mRNA in different tissues of hepatic cancer, liver, spleen, kidney, lung, muscle, heart and bowel in the orthotropic liver cancer mouse model evaluated by RT-PCR. Results are shown as means±SD (n = 3). (**P<0.01, compared with spleen, kidney, lung, muscle, heart and bowel; ## P<0.01, compared with liver). (B) 5-FU concentration in different tissues in mice were treated with i.v. 5-FU, CS/5-FU or GC/5-FU or, 5-FU determined 30 min post-injection. Results are shown as an means±SD (n = 3). Hepatic cancer tissue showed the highest 5-FU concentration, followed by liver tissue. (C) The ratio of 5-FU concentration in hepatic cancer cells relative to that in other tissues. The 5-FU concentration in hepatic cancer was 8.69-, 23.35-, 79.96- and 85.15-fold higher than that in normal liver tissue, kidney, heart and blood, respectively. (D) The weight of liver tumors measured on Day 10. Results are shown as means±SD deviation (n = 10). Mice received GC/5-FU,CS/5-FU, 5-FU, GC or PBS on Day 5 after establishing the transplant model. **P<0.01 compared to control or GC group; ##P<0.01 compared to 5-FU group, ▴P<0.05 compared to CS/5-FU group. (E)Body weight was monitored from Day 1 to 10 of treatment (n = 10). Body weigh decreased significantly more in the 5-FU group compared with the control, GC, CS/5-FU and GC/5-FU group. There was no difference in body weight between the GC/5-FU, CS/5-FU, GC and control groups. (F) Mouse survival. The median survival in the control, GC, 5-FU, CS/5-FU and GC/5-FU groups was 16, 17, 22, 29 and 35 days, respectively. The longest median survival time was seen in the GC/5-FU group.

