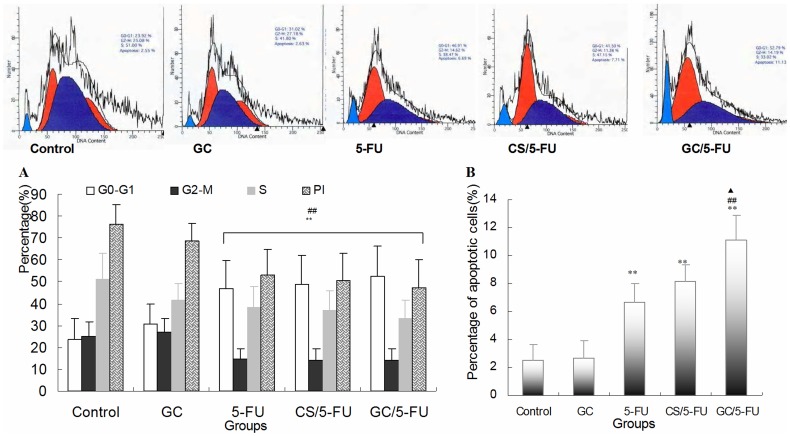
Figure 5. The effects of different treatments on cell cycle, proliferation index and apoptosis index by flow cytometry analysis of H22 cells.
(A) Quantification of cell cycle distribution and proliferation index of H22 cells. Percentage of cells in G0–G1 in the GC/5-FU,CS/5-FU and 5-FU groups was higher than in the control and GC groups, and the proliferation index decreased significantly in the other three groups (P<0.01). (B) Quantification of apoptosis of H22 in different treatment groups. The percentage of apoptotic cells in the GC/5-FU,CS/5-FU and 5-FU groups was significantly higher than in the control and GC groups (P<0.01). The percentage of apoptotic cells in the GC/5-FU group was also higher than in the 5-FU (P<0.01) and CS/5-FU groups (P<0.05). **P<0.01 compared with control or GC group; ##P<0.01 compared with the 5-FU group; ▴P<0.05 compared with the CS/5-FU group.

