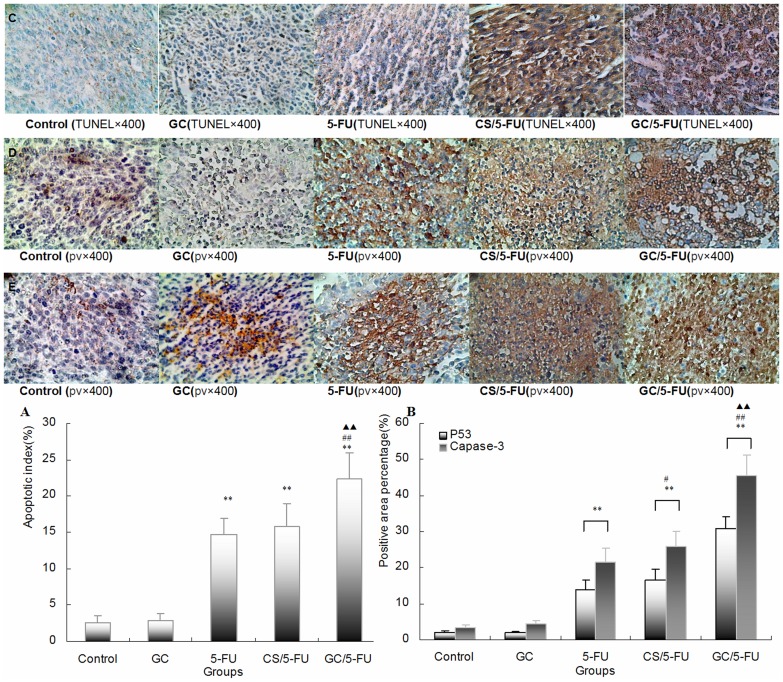
Figure 6. Apoptosis, p53 and caspase-3 expression were detected in tumor tissues in mouse model.
(A) The quantification of the apoptotic index (AI) in hepatic cancer tissues. Apoptosis was detected using the TUNEL assay on the tumor sections. The tumor samples from the control and GC groups showed little apoptosis; the addition of 5-FU and CS/5-FU induced sporadic apoptosis, while GC/5-FU induced a high degree of apoptosis which showed a clustered distribution (C). The AI in the GC/5-FU, CS/5-FU and 5-FU groups was higher than that in the GC and control groups (P<0.01). The expression of AI in the GC/5-FU group increased more than in the CS/5-FU or 5-FU groups (P<0.01). (B) Quantification of p53 and caspase-3 expression detected by IHC. P53 (D) and Caspase-3 (E) staining in the control and GC groups showed a scattered cytoplasmic distribution pattern, appearing as dark yellow or dark brown. In the 5-FU, CS/5-FU and GC/5-FU groups, P53 and caspase-3 showed a sheet staining pattern, which was most marked in the GC/5-FU group. The expression of P53 and caspase-3 was higher in the 5-FU, CS/5-FU and GC/5-FU groups than in the control or GC groups. The highest increase was seen in the GC/5-FU group (P<0.01). **P<0.01 compared with control or GC group; ##P<0.01 compared with the 5-FU group; ▴▴P<0.01 compared with the CS/5-FU group.

