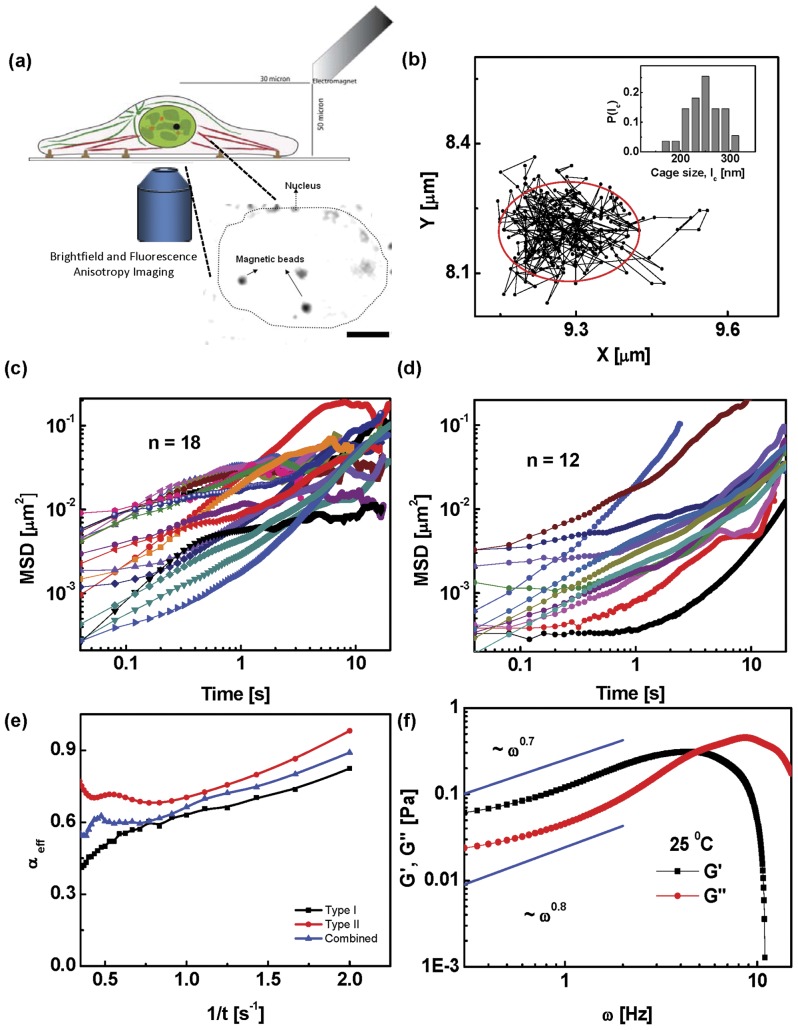
Figure 1. Single particle tracking analysis of particles in the nucleus.
(a) Schematic of the experimental setup. An electromagnet mounted on a fluorescence microscope is used to apply forces on a  m paramagnetic bead microinjected into the nucleus. (Inset) Brightfield image of the nucleus showing microinjected magnetic beads. The dotted line represents the edge of the nucleus. Scale bar
  m. (b) Typical trajectory of a bead in the nucleus of a living cell at
  C showing caging behaviour. (Inset) Histogram of cage sizes
  across
  beads shows a narrow distribution about
  nm. (c & d) Mean square displacement versus time for beads in the nuclei of untreated cells in the absence of force.
  beads show Type I behaviour and
  beads show Type II. (e) Mean effective exponent
  versus inverse time for Type I and II trajectories together with the combined data. (f) Shear and loss modulus,
  ,
,  (averaged over all beads) as a function of frequency
  . At low
  , the response of the nucleus is elastic (
 ) and crosses over to a viscous response at higher
  . Fits at low
  show that the nucleus behaves as a power-law solid at low frequencies.

