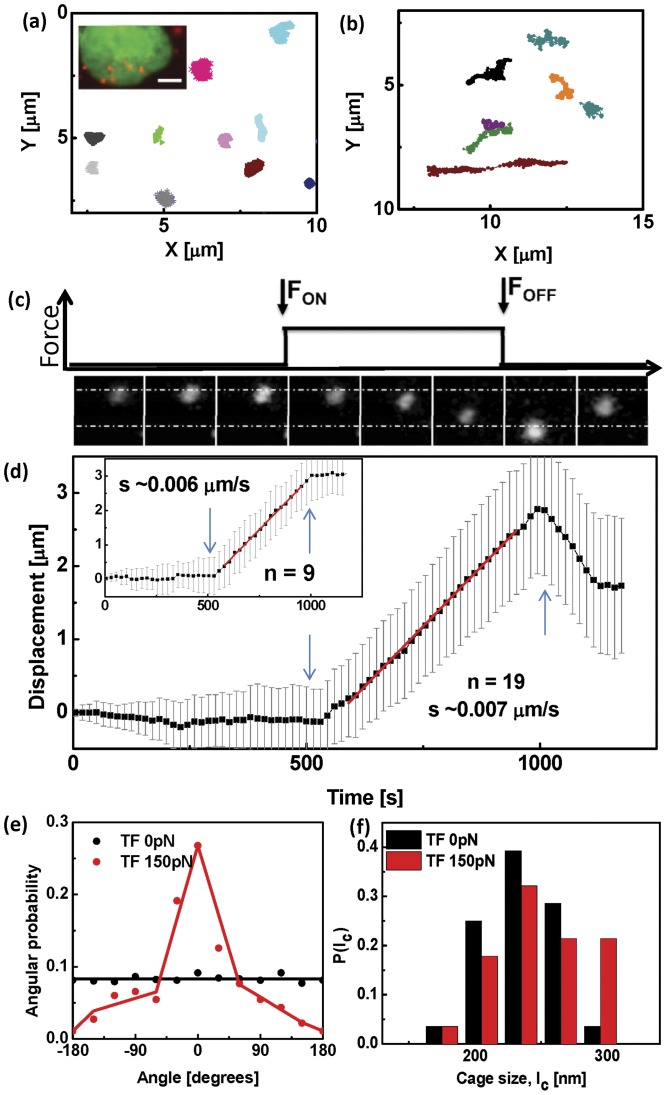
Figure 6. Force transduction within the nucleus.
Typical trajectories of TFs in the nuclei of cells at at 25 C, (a) in the absence of force and (b) under a
  pN force, applied on beads. (Inset) Fluorescence image showing H2B-EGFP marked nucleus in green and alexa546-UTP foci in red. Scale bar
  m. (c) Fluorescence images of the TFs at every
  s showing directed movement of the compartments in the presence of force. The black line represents the force profile. (d) Type I and Type II trajectories of Alexa546-UTP labelled TCs with
  pN force applied on
  m paramagnetic bead for
  s. TFs in the nucleus show directed movement in the same direction as the bead. Error bars denote standard deviation. (e) Probability distribution of the angle between the instantaneous displacement vector of the TFs and the direction of the
  pN external force, shows that the TFs move predominantly along the direction of the force. In the absence of a force, the movement of the TFs is isotropic.

