
Figure 5. Microscopic observations of the bacterial cells before and after treatment with the NaOH-SDS solution.
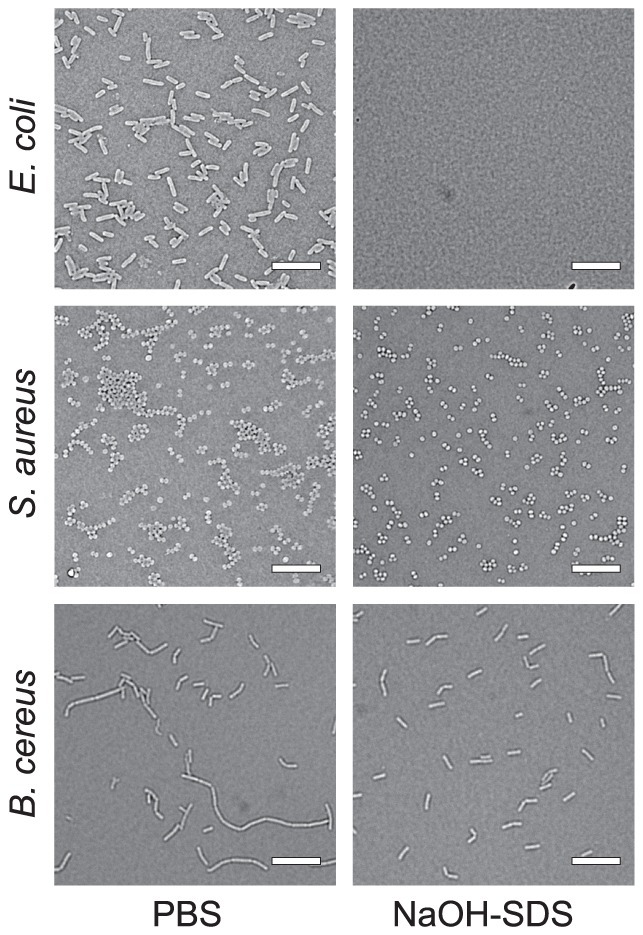
The upper panels show Escherichia coli, the middle ones show Staphylococcus aureus, and the lower ones show Bacillus cereus. The left panels show the negative control, and the right ones show the samples that were incubated with NaOH-SDS for 5 min. Bar = 10 µm.