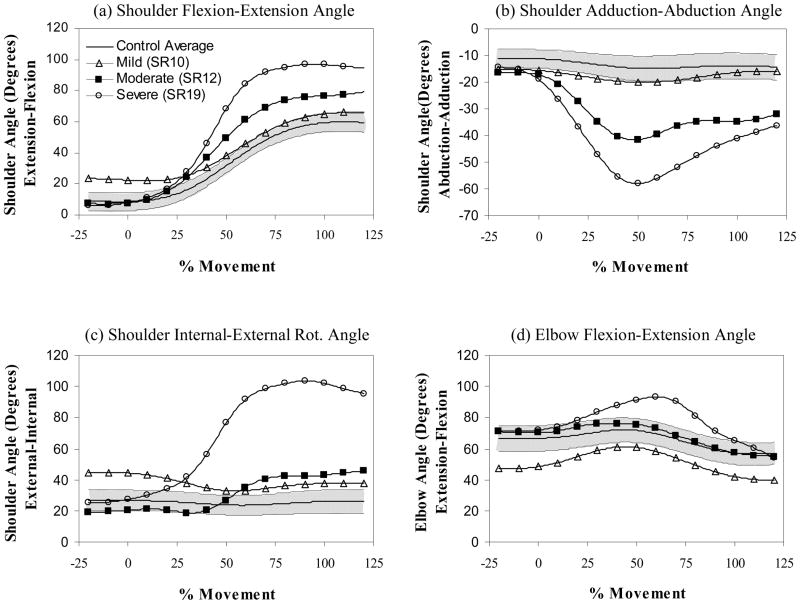
Figure 3.
Power profiles for planes defined by (a) shoulder flexion-extension, (b) shoulder adduction-abduction, (c) shoulder internal-external rotation, and (d) elbow flexion-extension. Joint power is shown on the vertical axis and normalized movement time on the horizontal axis. Power generation is positive and absorption is negative. Profiles are shown for mild (open triangle), moderate (filled square), and severe (open circle) impairments of the paretic arm (single trial profiles from individual subjects are shown compared to the control average (N=10 subjects)) compared to the control average (solid line) and range (1 standard deviation – shaded region). Notice how power shifts from the shoulder flexion-extension plane to the adduction-abduction plane as impairment increases. Mild, moderate and severe corresponded to approximately the lower, middle and upper third of the Fugl-Meyer range of scores for the paretic arm condition.

