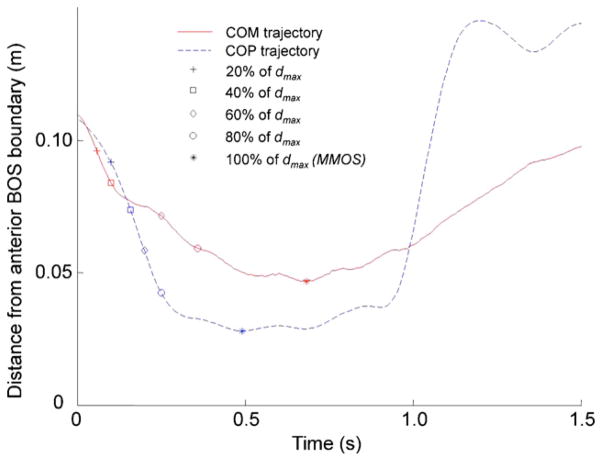
Fig. 3.
Raw tracing of the centre of mass (COM) and centre of pressure (COP) vs. time for a representative trial for 1.5 s following the instant of perturbation. Displayed on each curve are markers denoting the divisions between the five relative displacement regions (0–20% of maximum displacement (dmax), 20–40% dmax, etc.).

