
Table 1.
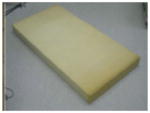
Photos and characteristics of the five floor conditions tested in this study. Footfall deflection values were estimated from force-deflection tests under a simulated 1000 N footfall using a rigid foot-shaped indenter mounted within a materials testing system (Laing and Robinovitch, 2009).
| Floor | Photo | Thickness (mm) | Footfall deflection (mm) | Density (kg/m3) |
|---|---|---|---|---|
| Rigid (Control) |
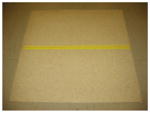
|
2 | – | – |
| SmartCell |
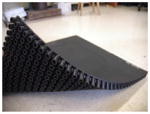
|
25 | 0.8 | 1120 |
| SofTile |
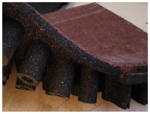
|
100 | 4.0 | 1057 |
| Firm-Foam |
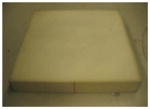
|
110 | 85.4 | 32 |
| Soft-Foam |
|
100 | 92.4 | 22.2 |