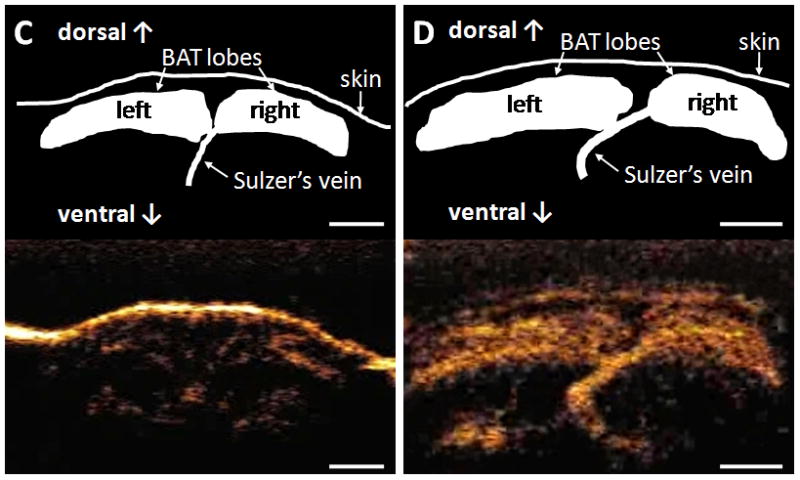
Figure 2.

Replenishment curves of contrast microbubbles, and schematic drawings and representative still-frames of brown adipose tissue (BAT) acquired by contrast ultrasound in wild-type mice. A and B: Representative replenishment curves of contrast microbubbles at baseline (A) and during infusion of 1 μg·kg−1·min−1 norepinephrine (B). C and D: Schematic drawing and representative still-frame of interscapular BAT at baseline (C) and during infusion of 1 μg·kg−1·min−1 norepinephrine (D). White bars represent 2.5 mm.
