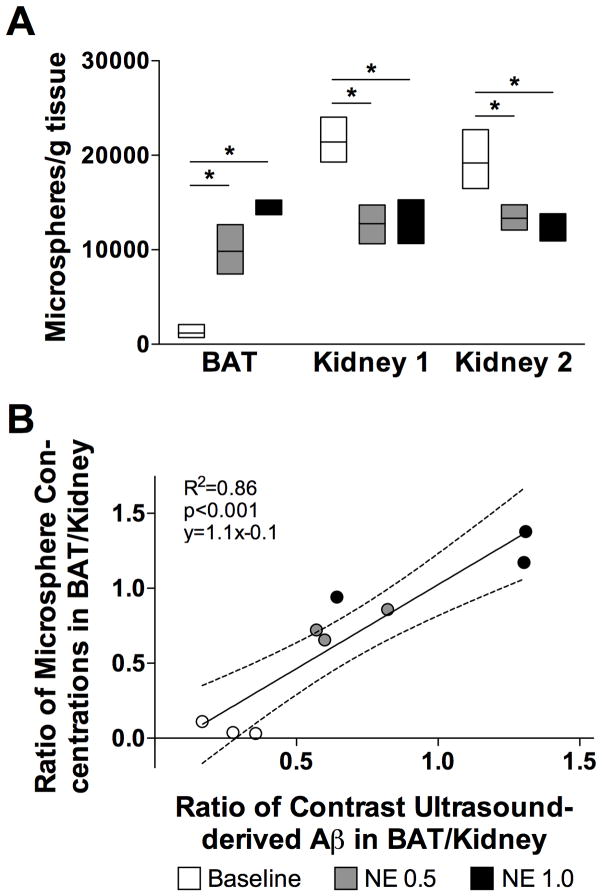
Figure 3.
Blood flow in brown adipose tissue (BAT) and kidney was assessed by contrast ultrasound (CU) and fluorescent microspheres. Baseline values are depicted in white (n=3). Values obtained at norepinephrine (NE) concentrations of 0.5 μg·kg−1·min−1 (n=3) and 1 μg·kg−1·min−1 (n=3) are depicted in grey and black, respectively. Data are shown as mean values±SEM. * p<0.05, NE differs from baseline. A: Microspheres-derived BAT and kidney blood flow. B: Correlation of CU-estimated and microspheres-derived BAT-to-kidney blood flow ratios.

