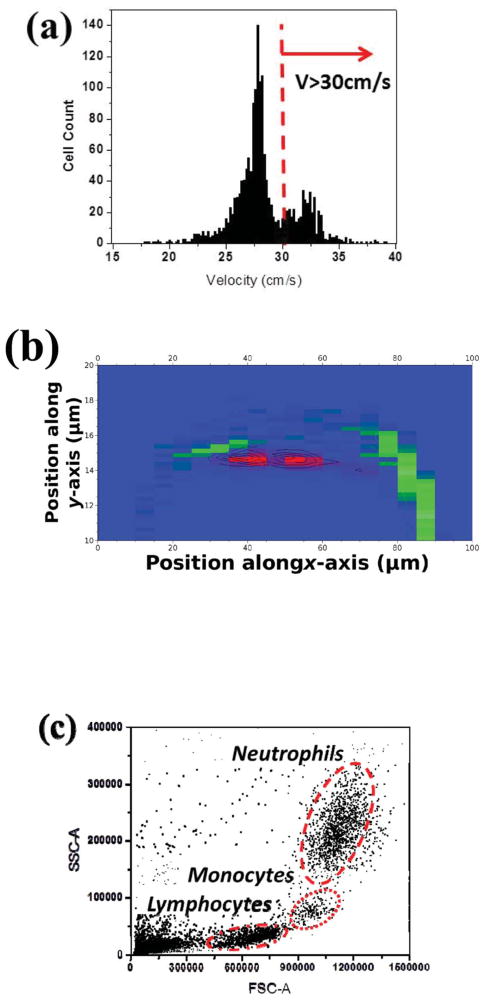
Fig. 4.
(a) A velocity histogram of white blood cells from 5 μL RBC-lysed whole blood sample (870 × dilution) at Re = 16.8. The histogram shows a distinguishable population of neutrophils due to their high deformability. The peak on the left of the neutrophil (i.e. V < 30 cm s−1) is the signal from other WBC types plus RBC residues, since the sample did not go through a centrifuge. (b) The distribution of RBC-lysed whole blood sample converted from (a) shows a separate band for neutrophils (red) from other cells (green). (c) A scatter plot of 5 μL RBC-lysed diluted whole blood sample (870 × vdilution) measured with a commercial flow cytometer (Accuri C6). Three populations clearly exhibit major WBC groups as the gating indicated.

