
Fig 3.
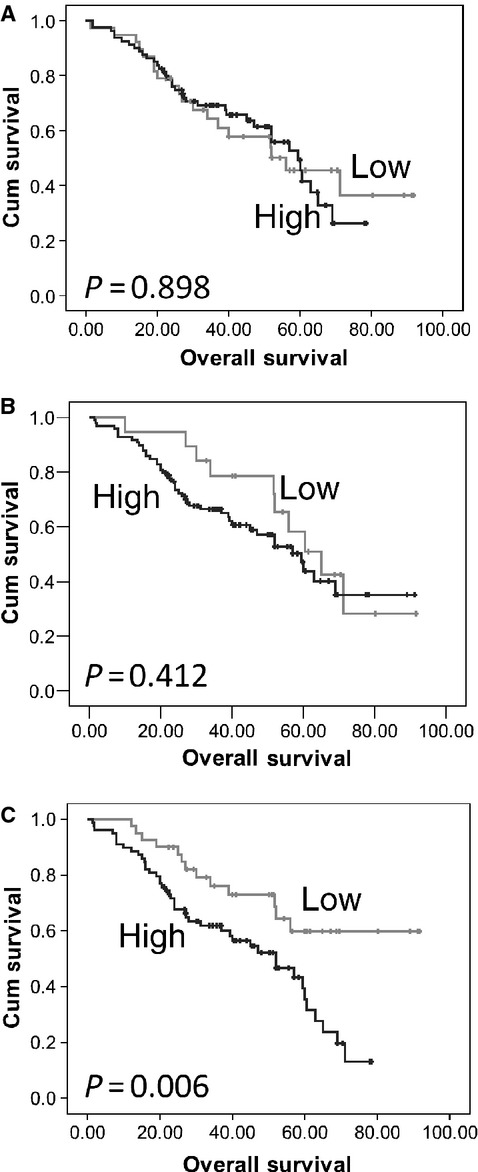
Kaplan–Meier analysis of overall survival showing the impact of calpastatin (A), calpain-1 (B) and calpain-2 (C) expression in cohort of 154 patients with significance determined using the log rank test. (A) low expression group has 38 observations and 19 events and high expression group has 80 observations and 37 events; (B) low expression group has 19 observations and 10 events and high expression group has 99 observations and 45 events; (C) low expression group has 40 observations and 13 events and high expression group has 78 observations and 44 events; where observations are the number of observations per group and events are those patients who died.