2.
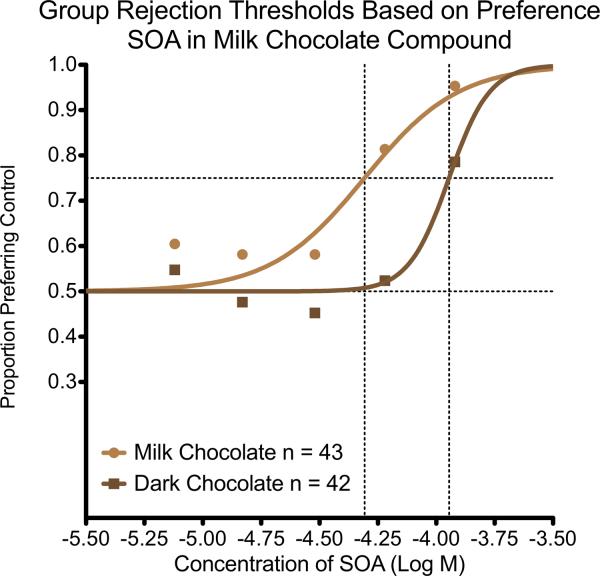
Group Rejection Thresholds Based on Preference for SOA in Solid Chocolate Proportion of participants preferring the un-spiked samples is plotted against concentration of SOA in the spiked sample. The circles (light brown) represent individuals who prefer milk chocolate when eating solid chocolate; the squares (dark brown) represent those who prefer dark chocolate. The chance-corrected concentration at which 50% of participants preferred the control, the rejection threshold, was significantly higher for those who prefer dark chocolate (p = .01).

